Zum Hauptinhalt springen
mtDNA · Mütterliche Linie

L2A1C

mtDNA Haplogroup L2A1C

Ein Referenzprofil für einen Abstammungszweig. Gemeinsame Haplogruppen begründen weder eine familiäre Beziehung noch eine kulturelle Identität.

Referenzprofil

Hintergrund des Zweigs

Historischer Kontext für den mtDNA-Abstammungszweig L2A1C

Origins and Evolution

mtDNA haplogroup L2A1C is a downstream branch of L2A1, itself a subclade of the widespread African lineage L2A. Based on the phylogenetic position within L2A1 and comparative coalescent estimates for sibling clades, L2A1C most likely arose in West/Central Africa in the Holocene, roughly in the range of ~4–8 kya (here estimated ~6 kya). Its emergence reflects continued diversification of the L2A maternal radiation after the Late Pleistocene, during a period of increasing regional population growth, localized expansions, and cultural changes in sub-Saharan Africa.

Detection and confident assignment to L2A1C normally requires complete mitogenome sequencing or typing of defining coding-region mutations; control-region (HVS) motifs can be suggestive but are insufficient to resolve L2A1 substructure with high confidence.

Subclades

As a relatively deep but not ancient subclade of L2A1, L2A1C may contain further downstream lineages (L2A1C1, L2A1C2, etc.) in well-sampled mitogenome datasets, though sampling density for L2A1C remains lower than for more common L2A branches. Published mitogenome surveys and population screens indicate L2A1C is a recognizable branch but with fewer named sublineages compared with the larger L2A clade; increasing whole-mtDNA sequencing of West and Central African populations is likely to reveal additional diversity within L2A1C.

Geographical Distribution

L2A1C is concentrated in West and Central Africa, with secondary presence across regions impacted by later demographic processes:

  • West Africa: Found among a variety of West African ethnic groups (e.g., Yoruba, Akan and other coastal and interior populations) at variable frequencies.
  • Central Africa: Present among Bantu-speaking and rainforest populations, including some populations in the Congo basin; occasional reports appear in groups traditionally classified as Pygmy or forest-dwelling peoples, reflecting regional gene flow.
  • Eastern and Southern Africa: Detected at lower frequencies in some Bantu-speaking communities and in populations affected by southward and eastward Bantu migrations.
  • African diaspora: Observed in African-descended populations in the Americas and the Caribbean as a consequence of the transatlantic slave trade; frequencies in the diaspora mirror source-region contributions and sampling biases.
  • North Africa / Middle East: Very low frequencies attributable to historical trans-Saharan or more recent movements.

Geographic distribution therefore reflects a West/Central African origin followed by Holocene expansions and the Bantu-associated dispersals, plus long-range movement through historic and recent migration.

Historical and Cultural Significance

While mtDNA lineages do not map one-to-one onto archaeological cultures, the demographic events that shaped the spread of L2A1C are tied to major cultural processes in sub-Saharan Africa. In particular:

  • Bantu expansion: The timing and geographic distribution of L2A1C are consistent with participation of women carrying this lineage in Bantu-speaking migrations that began in parts of West/Central Africa and spread south and east during the last several thousand years. This makes L2A1C a useful marker for studies tracing maternal contributions to Bantu-associated gene pools.
  • Regional continuity and admixture: The presence of L2A1C in rainforest and coastal groups indicates local continuity and inter-group female-mediated gene flow throughout the Holocene.
  • African diaspora: L2A1C appears among African-descended populations in the Americas and Caribbean, and therefore contributes to reconstructing source-region ancestries in historical diaspora genetics.

Culturally, mtDNA markers like L2A1C are widely used in genetic genealogy and population history to infer maternal lineages, maternal continuity, and patterns of sex-biased migration when combined with Y-chromosome and autosomal data.

Conclusion

mtDNA haplogroup L2A1C is a Holocene West/Central African maternal lineage that exemplifies regional diversification within L2A and the later demographic processes (notably the Bantu expansion and historical diaspora movements) that shaped modern distributions. Continued mitogenome sequencing across under-sampled African populations will refine the internal branching, age estimates, and geographical nuances of L2A1C and its sublineages.

Wichtige Punkte

  • Origins and Evolution
  • Subclades
  • Geographical Distribution
  • Historical and Cultural Significance
  • Conclusion
Referenzprofil

Baum und Verwandtschaft

Phylogenetischer Kontext und Subkladen

Entwicklungsweg

Folgen Sie den erfassten übergeordneten Zweigen bis L2A1C. Die Daten sind Schätzungen und können sich ändern, wenn Referenzdaten überarbeitet werden.

Schritte Haplogruppe Altersschätzung Archäologische Epoche Vergangene Zeit Unmittelbare Nachkommen Getestete moderne Nachkommen Antike Verknüpfungen
1 L2A1C Aktuell ~6,000 years ago Chalcolithic 6,000 Jahre 1 134 0
2 L2A1A ~8,000 years ago Neolithic 8,000 Jahre 4 341 4
3 L2A1 ~18,000 years ago Mesolithic 18,000 Jahre 2 606 0
4 L2A1'2'3'4 - - - 2 616 0
5 L2A ~50,000 years ago Paleolithic 50,000 Jahre 2 642 12
6 L2A'B'C'D - - - 2 989 0
7 L2 ~70,000 years ago Paleolithic 70,000 Jahre 4 1,045 7
8 L2'3'4'6 - - - 2 31,333 0
9 L2'3'4'5'6'7 - - - 2 31,349 0
10 L1'2'3'4'5'6'7 - - - 2 31,852 0
11 L ~160,000 years ago Paleolithic 160,000 Jahre 2 32,236 5

Geschwisterzweige (3)

Weitere Zweige derselben übergeordneten Haplogruppe

Referenzprofil

Verbreitung weltweit

Geografische Verbreitung und moderne Präsenz

Erfasster Ursprung

West/Central Africa

Moderne Verbreitung

The populations where mtDNA haplogroup L2A1C is found include:

  1. Yoruba and other coastal West African groups (e.g., Akan)
  2. Various Bantu-speaking populations across Central Africa (e.g., Kongo-related groups)
  3. Central African rainforest populations (including some Mbuti and other Pygmy-associated groups)
  4. Eastern and Southern African Bantu-speaking communities at lower frequencies
  5. African-descended populations in the Americas and the Caribbean (African American, Afro-Caribbean)
  6. Cape Verdean and other Atlantic-island populations with West African ancestry
  7. North African and some Middle Eastern groups at very low frequencies due to historical admixture
Historischer Kontext

Ein Zweig durch die Zeit

Geschätzte Entstehung in einer breiten historischen Zeitleiste. Zeitmarken liefern Kontext und implizieren keine Verbindung zu bestimmten Kulturen.

  1. ~10k Jahre zurück

    Neolithische Revolution

    Beginn der Landwirtschaft und feste Siedlungen

  2. ~6k Jahre zurück

    Haplogruppe L2A1C

    Geschätzte Entstehung dieses mtDNA-Zweigs; Daten und Orte sind Referenzschätzungen.

    Dieser Zweig
  3. ~5k Jahre zurück

    Bronzezeit

    Metallverarbeitung, Schrift und frühe Zivilisationen

  4. ~3k Jahre zurück

    Eisenzeit

    Eisenwerkzeuge und ausgedehnte Handelsnetze

  5. ~2.5k Jahre zurück

    Klassische Antike

    Blüte griechischer und römischer Kulturen

  6. Gegenwart

    Gegenwart

    Moderne Zeit

Referenzprofil

Archäologischer Kontext

Erfasste archäologische Zuordnungen für den mtDNA-Zweig L2A1C

Erfasste Zuordnungen

Diese Bezeichnungen beschreiben archäologische Kontexte erfasster Referenzproben mit Bezug zu L2A1C. Eine Zuordnung bedeutet nicht, dass alle Träger einer Kultur angehörten oder einer bestimmten Migrationsroute folgten.

El Argar Luxmanda Culture Makwasinyi Modern Period Mtwapa Nubian Christian Roman Provincial Roman Sardinian
Kulturzuordnungen basieren auf dem archäologischen Kontext antiker DNA-Proben und können regionale Verknüpfungen in bestimmten Zeiträumen widerspiegeln.
Referenzprofil

Probencatalog

2 Subkladen-Träger der Haplogruppe L2A1C (keine direkten Träger in der aktuellen Referenzauswahl)

2 angezeigt · 2 passende Proben

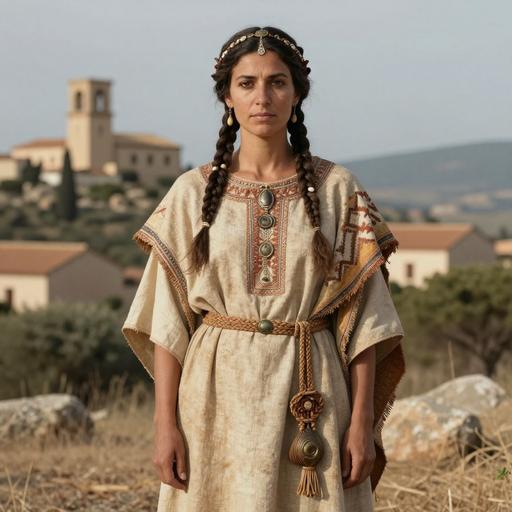
Porträts sind KI-generierte Illustrationen. Probenbezeichnungen und Zugangs-IDs identifizieren die Referenzdatensätze.

Porträt Probe Land Epoche Datum Kultur mtDNA Übereinstimmung
KI-generiertes illustratives Porträt von Sardinia IA a IA b Nuragic-1 individual, Sardinia. Villamar. VS. Villamar, Italy (788-551 BCE)
Proben-ID: VIL006
Italy Iron Age Punic 1 Sardinia, Italy 788-551 calBCE (2530±20 BP) Early Punic Sardinian L2a1c3b1 Subklade
KI-generiertes illustratives Porträt von Lazio Early Medieval individual, Lazio. Viterbo. Tarquinia, Italy (893-1,022 CE)
Proben-ID: TAQ011
Italy Early Medieval Viterbo, Lazio, Italy 893-1022 calCE (1081±27 BP, MAMS-40628) Viterbo Culture L2a1c3a Subklade
MATERNAL LINEAGE · ANCIENT DNA

Ancient lineage evidence map

Follow parent clades toward this branch and explore where ancient carriers were found.

Loading ancient observations…

Markers are archaeological find locations. A dashed connector is an uncertain, proposed geographic transition between consecutive branches supported by multiple dated observations; it is not an exact travel route, birthplace or proof of direct descent. Parent-clade samples may belong to other descendant branches. Gaps remain where evidence is insufficient. Sample dates differ from haplogroup formation dates.

Referenzprofil

Trägerverteilungskarte

Geografische Verteilung von 2 antiken DNA-Proben (direkte und Subkladen-Träger von L2A1C)

Subkladen-Träger
Zeitraumfilter
Alle Zeiträume
Alle Proben werden angezeigt
Referenzprofil

Zeitliche Verteilung

Verteilung der Träger über archäologische Epochen

Referenzprofil

Geografische Verteilung

Anzahlen nach erfasstem Probenland. Sie spiegeln die verfügbare Referenzauswahl wider, nicht Bevölkerungshäufigkeiten.

Referenzprofil

Verteilung Land × Epoche

Vergleichen Sie erfasste Probenanzahlen nach Ländern und archäologischen Epochen. Wählen Sie eine belegte Zelle, um eine Probe anzusehen.

Daten

Daten und Herkunft

Quellenangaben und Datenqualität

Zuletzt aktualisiert 2026-02-16
Konfidenzwert 50/100
Abdeckung Low

Datenquelle

Klassifikation, geschätzte Daten und geografischer Kontext spiegeln die erfassten Referenzdaten wider und können sich bei überarbeiteten Belegen ändern. Die Probenabdeckung ist ungleichmäßig; erfasste Orte und archäologische Zuordnungen begründen weder persönliche Herkunft noch kulturelle Identität.