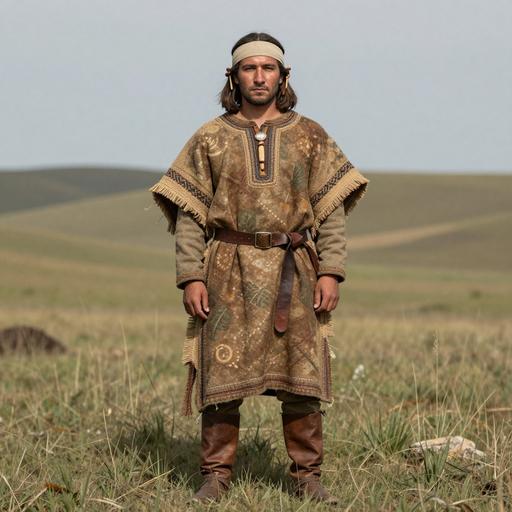
Hintergrund des Zweigs
Historischer Kontext für den mtDNA-Abstammungszweig T1
Haplogroup T1 is a mitochondrial DNA (mtDNA) subclade of the broader haplogroup T, which is part of the larger macrohaplogroup N. Haplogroup T is believed to have originated in the Near East or the eastern Mediterranean around 40,000 years ago, and it spread widely across Europe, the Near East, and parts of Central Asia. Haplogroup T1, a significant subclade of T, has played an important role in the genetic history of these regions, particularly in relation to early agricultural societies, and is found today in populations across Europe, the Middle East, and North Africa.
Origin and Evolution
Haplogroup T1 is estimated to have originated around 10,000 to 15,000 years ago, likely in the Near East or surrounding regions. It is a descendant of haplogroup T, which emerged approximately 40,000 years ago. T1 developed during the period of early human migrations and population expansions, coinciding with the rise of agriculture in the Neolithic era.
The spread of T1 is closely associated with the expansion of early agricultural societies from the Near East into Europe and North Africa. As these populations moved and settled in new areas, they carried T1 along with them, contributing to its widespread distribution in modern populations.
Geographic Distribution and Significance
Haplogroup T1 is found in populations across Europe, the Near East, North Africa, and parts of Central Asia. Its geographic distribution reflects ancient migratory patterns, including the Neolithic expansion of farming communities and later migrations and interactions between these regions.
Near East and Middle East
Levant: T1 is present at notable frequencies in populations from the Levant (modern-day Israel, Lebanon, Jordan, and Syria). The region has long been a hub for human migrations, and T1 likely spread with early agricultural societies during the Neolithic period, when farming practices first emerged in the Fertile Crescent.
Arabian Peninsula: T1 is also found in populations from the Arabian Peninsula, particularly in Saudi Arabia and Oman, reflecting historical connections between the Near East and North Africa as well as later movements linked to trade routes such as the Silk Road and the Arab Slave Trade.
Europe
Southern Europe: Haplogroup T1 is found at moderate frequencies in Southern Europe, particularly in Italy, Greece, and the Balkans. These regions were important centers of ancient human migrations from the Near East, particularly during the spread of agriculture in the Neolithic period.
Western and Central Europe: T1 is also present in Western and Central Europe, particularly in France, Germany, and the Iberian Peninsula. The presence of T1 in these areas reflects its spread during the Neolithic expansion and subsequent historical migrations, such as those of the Indo-Europeans.
North Africa
- Egypt and Morocco: T1 is found at lower frequencies in North Africa, particularly in Egypt and Morocco. Its presence here likely reflects ancient connections between the Near East and North Africa, as well as more recent historical interactions, such as the Arab expansion.
Central Asia
- Iran, Afghanistan, and Turkmenistan: Haplogroup T1 has been detected in populations from Iran and Central Asia, particularly in Afghanistan and Turkmenistan. These areas were key migratory corridors linking the Near East to Central Asia, and T1's presence reflects ancient population exchanges along trade routes like the Silk Road.
Role in Human Migration
Haplogroup T1 is closely associated with the Neolithic agricultural revolution, which saw the spread of farming societies from the Near East into Europe around 9,000 to 7,000 years ago. As early farmers moved into Europe, they brought with them new technologies, agricultural practices, and genetic lineages like T1. This wave of migration had a significant impact on the genetic landscape of Europe and contributed to the widespread presence of T1 in modern European populations.
The Neolithic Expansion
The Neolithic expansion was one of the most important population movements in human prehistory, as it involved the transition from hunter-gatherer societies to settled agricultural communities. This expansion began in the Fertile Crescent (modern-day Iraq, Syria, Turkey, and Lebanon) and spread into Europe and North Africa. Haplogroup T1 was carried by these early farming populations, which contributed to its distribution in Southern Europe and the Mediterranean Basin.
Later Migrations and Historical Movements
Beyond the Neolithic expansion, T1 was further spread by later historical migrations, such as the Indo-European migrations, the Arab expansion, and movements along the Silk Road. These migrations contributed to the spread of T1 into Central Asia, North Africa, and parts of Southern Europe.
Subclades of Haplogroup T1
Haplogroup T1 is divided into several subclades, each reflecting specific population histories and migration patterns. These subclades are identified through specific genetic mutations and have been studied in both modern and ancient populations.
T1a: This is one of the most widespread subclades of T1 and is found throughout Europe, the Near East, and North Africa. T1a is particularly common in populations from Southern Europe, the Balkans, and the Middle East, reflecting its role in the Neolithic expansion of farming populations.
T1b: Found primarily in the Near East and parts of Europe, T1b is less common but still significant for understanding the genetic diversity within T1. It may represent a more localized population movement within the Near East or the eastern Mediterranean.
Ancient DNA and Archaeological Evidence
Ancient DNA studies have provided important insights into the spread and distribution of haplogroup T1 in prehistoric populations. These studies, combined with archaeological evidence, help trace the migratory routes of populations carrying T1 and their role in the development of early farming societies.
Neolithic Farmers in Europe: Ancient DNA from Neolithic archaeological sites in Europe has revealed the presence of haplogroup T1 in early farming populations. These findings confirm that T1 was carried by Neolithic farmers as they spread from the Near East into Europe, contributing to the genetic makeup of modern European populations.
Near East and the Fertile Crescent: Ancient DNA from human remains in the Fertile Crescent has shown that T1 was present in early agricultural communities, reinforcing the idea that it played a key role in the spread of farming practices.
Modern Distribution and Frequency
Today, haplogroup T1 is found at varying frequencies across Europe, the Near East, North Africa, and Central Asia:
Southern Europe: T1 is found in populations from Italy, Greece, and the Balkans, where it reflects ancient connections with the Near East and the spread of farming populations during the Neolithic.
Near East: T1 is relatively common in the Levant and the Arabian Peninsula, particularly in Lebanon, Jordan, and Saudi Arabia, where it is part of the genetic legacy of ancient migrations and trade routes.
North Africa: T1 is present in populations from Egypt and Morocco, reflecting ancient connections between North Africa and the Near East.
Central Asia: T1 is also found in Iran, Afghanistan, and parts of Central Asia, where it likely spread through ancient trade routes like the Silk Road.
Genetic and Evolutionary Significance
Haplogroup T1 is significant for understanding the genetic history of Europe, the Near East, and North Africa, particularly in relation to the spread of early agricultural societies during the Neolithic. As one of the key mitochondrial lineages associated with the Neolithic expansion, T1 provides insights into how early farming populations migrated, settled, and interacted with existing hunter-gatherer communities.
Conclusion
Haplogroup T1 is an important mitochondrial DNA lineage that likely originated around 10,000 to 15,000 years ago in the Near East. It spread widely across Europe, the Near East, North Africa, and parts of Central Asia, particularly during the Neolithic expansion of farming populations. The presence of T1 in modern populations reflects its ancient role in human migrations and its contribution to the genetic diversity of these regions.
As a key subclade of haplogroup T, T1 provides valuable insights into early human migrations, the development of agricultural societies, and the historical connections between Europe, the Near East, and North Africa. Its study helps to illuminate the genetic and cultural history of populations across these regions and contributes to a deeper understanding of human evolutionary history.
Wichtige Punkte
- Origin and Evolution
- Geographic Distribution and Significance
- Role in Human Migration
- Subclades of Haplogroup T1
- Ancient DNA and Archaeological Evidence