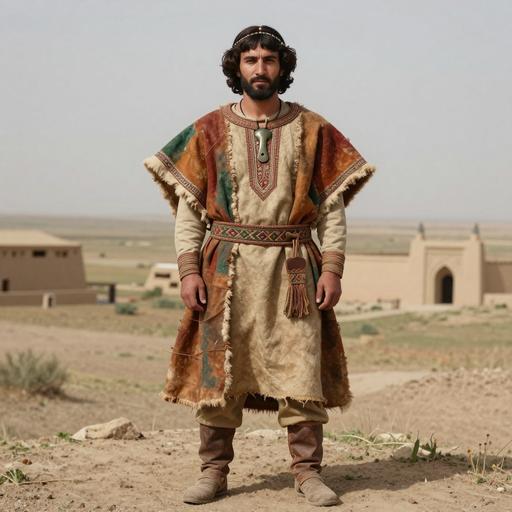
Hintergrund des Zweigs
Historischer Kontext für den mtDNA-Abstammungszweig T2
Haplogroup T2 is a mitochondrial DNA (mtDNA) subclade of haplogroup T, which is part of the broader JT mitochondrial lineage. Haplogroup T2 is one of the most well-studied subclades of T and is of significant interest due to its association with Neolithic farming populations and its widespread presence in modern-day Europe, the Near East, Central Asia, and parts of North Africa. As a lineage that has been shaped by ancient human migrations and the spread of agriculture, T2 plays an important role in understanding the genetic history of these regions.
Origin and Evolution
Haplogroup T2 is believed to have originated around 21,000 to 25,000 years ago, likely during the Upper Paleolithic period. It is thought to have arisen in the Near East or West Asia, regions that were key centers of early human migrations and cultural developments, particularly during the Neolithic period when agriculture began to spread.
Haplogroup T2 is a descendant of the broader haplogroup T, which likely originated in the Near East around 45,000 years ago. The T lineage played a significant role in the peopling of Europe during the Paleolithic and Neolithic periods, with haplogroup T2 becoming particularly prominent among early European farming populations.
Geographic Distribution and Significance
Haplogroup T2 is widely distributed across Europe, the Near East, and Central Asia, where it has been detected at varying frequencies. Its presence in these regions reflects the significant migratory and demographic changes that occurred over the past 10,000 years, particularly with the spread of Neolithic agriculture from the Near East into Europe.
Europe
Western Europe: Haplogroup T2 is found at moderate frequencies across much of Western Europe, including in populations from France, Germany, Spain, and the British Isles. In these regions, T2 is often associated with the early Neolithic farmers who migrated into Europe from the Fertile Crescent, bringing agriculture and new technologies. Ancient DNA studies have shown that T2 was common among these early farming communities, and it has persisted in the modern populations of Western Europe.
Eastern Europe: T2 is also present in Eastern Europe, particularly in populations from Poland, Ukraine, and the Balkans. These regions served as key migratory routes for Neolithic populations moving from the Near East into Europe, and T2 likely played a role in this process.
Near East and Central Asia
Turkey, Iran, and Caucasus: In the Near East, haplogroup T2 is found at significant frequencies, particularly in Turkey, Iran, and the Caucasus. These regions were crucial centers of early human migration and the development of agriculture during the Neolithic period. T2's presence in the Near East reflects its long-standing association with the ancient populations that inhabited these areas.
Central Asia: T2 is also found in Central Asian populations, including those from Kazakhstan, Uzbekistan, and Tajikistan. Its presence in these regions suggests ancient migration patterns that connected the Near East and Europe with Central Asia.
North Africa
- Egypt and Libya: Haplogroup T2 has been detected in North Africa, particularly in Egypt and Libya. This distribution likely reflects ancient migratory movements between the Near East and North Africa, possibly through trade routes and population exchanges in the Mediterranean region.
Role in Human Migration
Haplogroup T2 is crucial for understanding the Neolithic revolution and the spread of agriculture from the Near East into Europe. During the Neolithic period (around 9,000 years ago), farming populations from the Near East began to migrate into Europe, bringing new technologies, domesticated animals, and agricultural practices. Haplogroup T2 was one of the mitochondrial lineages carried by these early farmers, and it spread widely across Europe as a result of these migrations.
Neolithic Expansion into Europe
The Neolithic expansion was one of the most significant demographic events in European prehistory, and haplogroup T2 played a major role in this process. Archaeological and genetic evidence shows that populations carrying T2 moved from the Fertile Crescent (modern-day Turkey, Iran, and the Levant) into Southeastern Europe and eventually spread throughout Western and Northern Europe.
Early European Farmers: Ancient DNA studies have identified haplogroup T2 in Neolithic farmers from sites across Europe, including in Germany, France, and Hungary. These early farming populations, often associated with cultures such as the Linear Pottery Culture (LBK) and Cardial Ware Culture, were key in the agricultural revolution that transformed Europe’s genetic landscape.
Migration Routes: The migration of Neolithic farmers into Europe followed both coastal and inland routes. T2's presence in Italy, Spain, and the Balkans suggests that some populations moved westward along the Mediterranean coast, while others spread through inland routes into Central and Northern Europe.
Central Asia and Beyond
In addition to its role in the Neolithic expansion, haplogroup T2 has also been involved in ancient migratory movements between Europe, the Near East, and Central Asia. These migrations likely occurred during the Bronze Age and later periods, when population movements across the Eurasian Steppe connected the genetic lineages of these regions.
Subclades of Haplogroup T2
Haplogroup T2 is divided into several subclades, each of which provides insights into the ancient migration and population history of the regions where they are found:
T2a: One of the most common subclades of T2, T2a is found throughout Europe and the Near East. It is associated with the early Neolithic farmers who spread agriculture across Europe and has been identified in ancient DNA from Neolithic sites in Germany, Hungary, and France.
T2b: This subclade is found in Western Europe, particularly in France, Spain, and the British Isles. It likely reflects the spread of Neolithic farming populations into Western Europe.
T2c: T2c is more common in Eastern Europe and Central Asia, where it may be associated with later migrations, including those during the Bronze Age.
T2e: Found at lower frequencies in Europe and the Near East, this subclade provides evidence of ancient migratory connections between these regions.
T2f: This subclade is rarer and has been detected in populations from the Caucasus and Iran, suggesting a localized ancient population in this region.
Ancient DNA and Archaeological Evidence
Ancient DNA studies have been instrumental in tracing the distribution and migration history of haplogroup T2. Genetic evidence from Neolithic and Bronze Age remains has shown that T2 was widespread among early European farming populations.
Neolithic Farmers: Haplogroup T2 has been identified in Neolithic remains from archaeological sites in Germany, Hungary, and France, confirming its presence among the early agricultural communities that settled in Europe after migrating from the Near East.
Bronze Age Central Asia: Haplogroup T2 has also been detected in ancient remains from Central Asia, particularly from Bronze Age cultures. This suggests that populations carrying T2 participated in the migratory movements across the Eurasian Steppe during this period.
Modern Distribution and Frequency
Today, haplogroup T2 is found at varying frequencies in populations across Europe, the Near East, Central Asia, and North Africa:
Europe: T2 is found in moderate frequencies across Western, Central, and Eastern Europe, particularly in populations from Germany, France, Italy, and the British Isles. It is also present in Scandinavia, where it reflects the historical migrations of early European farmers.
Near East: In the Near East, haplogroup T2 is found in populations from Turkey, Iran, and the Caucasus, where it is likely linked to the early Neolithic populations of the region.
Central Asia: T2 is present in populations from Kazakhstan, Uzbekistan, and Tajikistan, reflecting the ancient migratory connections between Europe, the Near East, and Central Asia.
North Africa: T2 is found at low frequencies in Egypt and Libya, suggesting ancient gene flow between the Near East and North Africa.
Genetic and Evolutionary Significance
Haplogroup T2 is significant for understanding the spread of Neolithic agriculture and the genetic changes that accompanied the transition from hunting and gathering to farming in Europe and the Near East. The presence of T2 among early Neolithic farmers, as well as its persistence in modern European and Near Eastern populations, highlights its role in shaping the genetic landscape of these regions over thousands of years.
Conclusion
Haplogroup T2 is a mitochondrial DNA lineage that emerged around 21,000 to 25,000 years ago in the Near East and played a central role in the spread of Neolithic farming populations into Europe. It is widely distributed across Europe, the Near East, Central Asia, and parts of North Africa, where it reflects ancient human migrations and population expansions. As one of the key mitochondrial haplogroups associated with the Neolithic revolution, T2 provides important insights into the genetic and demographic history of these regions.
Wichtige Punkte
- Origin and Evolution
- Geographic Distribution and Significance
- Role in Human Migration
- Subclades of Haplogroup T2
- Ancient DNA and Archaeological Evidence