Zum Hauptinhalt springen
mtDNA · Mütterliche Linie

T

mtDNA Haplogroup T

Ein Referenzprofil für einen Abstammungszweig. Gemeinsame Haplogruppen begründen weder eine familiäre Beziehung noch eine kulturelle Identität.

Referenzprofil

Hintergrund des Zweigs

Historischer Kontext für den mtDNA-Abstammungszweig T

Haplogroup T is a mitochondrial DNA (mtDNA) haplogroup that is maternally inherited and plays a significant role in tracing the maternal ancestry of populations in Europe, the Near East, Central Asia, and North Africa. This haplogroup is a descendant of haplogroup JT, which further branches into haplogroups J and T, with haplogroup T being the focus of migration patterns and genetic studies, especially in relation to the spread of Neolithic farming communities and later historical migrations.

Origin and Evolution

Haplogroup T is believed to have originated approximately 25,000 to 30,000 years ago, likely in the Near East or Western Asia. It is a direct descendant of haplogroup JT, which itself derives from the broader haplogroup R. Haplogroup T’s emergence is closely tied to the Upper Paleolithic period, which saw significant population migrations and cultural developments, as well as to later events such as the Neolithic expansion and migrations during the Bronze Age.

Subclades of Haplogroup T

Haplogroup T is divided into several important subclades, each with distinct geographic distributions and historical significance:

  1. T1: This subclade is primarily found in Europe, the Near East, and North Africa. T1a is the most common subclade, with its presence particularly noted in European populations.

  2. T2: This is the more widespread and diverse subclade of haplogroup T, found across Europe, the Near East, and Central Asia. T2 has numerous sub-branches, indicating ancient migrations and genetic diversification, with significant frequencies in Western and Northern Europe.

Geographic Distribution and Significance

Europe

Haplogroup T is widely distributed across Europe, where it is particularly common in populations in Western, Central, and Northern Europe. Its frequency in Europe likely reflects the migration patterns of early Neolithic farmers, who spread from the Near East into Europe around 9,000 to 7,000 years ago. These early agriculturalists carried haplogroup T, among other lineages, and contributed to the genetic landscape of modern European populations.

  • Western Europe: Haplogroup T is present in countries like France, Germany, and the British Isles, where it has persisted through various historical migrations.
  • Northern Europe: T2 subclades are more common in Scandinavia and surrounding regions, reflecting migration patterns during the Bronze Age and the later Viking expansions.

Near East

Haplogroup T is also common in the Near East, where it likely originated. It is found in populations from Israel, Lebanon, Turkey, and Jordan. The Near East is a critical region for the development of agriculture, and haplogroup T’s presence here reflects its ancient roots in these early farming societies.

The spread of haplogroup T into Europe is closely tied to the movement of Neolithic farming communities from the Near East, particularly through Anatolia and into the Balkans.

Central Asia and North Africa

In Central Asia, haplogroup T is present at lower frequencies, reflecting historical migrations and trade routes that connected Europe, the Near East, and Asia. Its presence in North Africa, particularly in Berber populations, also points to ancient migratory connections between these regions and the Mediterranean basin.

Role in Human Migration

Haplogroup T is significant for understanding the Neolithic expansion, one of the most important migratory events in human history. During the Neolithic period, early farmers from the Near East migrated into Europe, bringing with them domesticated plants and animals, as well as new farming technologies. This migration, which took place around 9,000 to 7,000 years ago, had a profound impact on the genetic makeup of European populations, and haplogroup T played a key role in this process.

Later migrations, such as those during the Bronze Age and subsequent historical periods, likely contributed to the further spread of haplogroup T across Europe and into Central Asia and North Africa. The movement of peoples along ancient trade routes, such as the Silk Road, may have also facilitated the dispersal of haplogroup T into more distant regions.

Ancient DNA and Archaeological Evidence

Ancient DNA studies have identified haplogroup T in several prehistoric human remains from Neolithic and Bronze Age archaeological sites in Europe and the Near East. These findings provide direct evidence of haplogroup T’s role in the migration of early farming communities into Europe.

  • In Neolithic Europe, haplogroup T has been detected in early farming populations, particularly in Central Europe, the British Isles, and Scandinavia.
  • In the Near East, ancient DNA from early farming sites in Turkey and Israel has revealed the presence of haplogroup T, further supporting the theory that this haplogroup originated in the Near East and spread into Europe with the advent of agriculture.

Modern Distribution and Frequency

Haplogroup T is found at varying frequencies in modern populations, particularly in Europe, the Near East, and North Africa:

  • In Western and Central Europe, haplogroup T accounts for around 10% of maternal lineages, with higher frequencies in certain regions such as the British Isles and Germany.
  • In the Near East, haplogroup T is present in significant frequencies, particularly in Israel, Lebanon, and Turkey.
  • In North Africa, haplogroup T is found at lower frequencies, particularly in Berber populations, indicating ancient connections with the Mediterranean and Europe.

Genetic and Evolutionary Significance

Haplogroup T is significant for understanding the genetic history of Europe, the Near East, and North Africa. Its wide distribution and evolutionary history make it a key marker for studying ancient human migrations, particularly those associated with the Neolithic expansion and later migrations during the Bronze Age.

As one of the maternal lineages associated with the spread of farming communities from the Near East into Europe, haplogroup T reflects the complex genetic and cultural exchanges that shaped the early development of European societies. Its presence in both ancient and modern populations highlights its role in the genetic diversity of these regions.

Conclusion

Haplogroup T is a mitochondrial DNA lineage with deep historical roots in the Near East and a wide distribution across Europe, North Africa, and Central Asia. Originating around 25,000 to 30,000 years ago, haplogroup T played a significant role in the Neolithic expansion, when early agriculturalists migrated from the Near East into Europe, bringing with them farming practices that transformed human societies.

Today, haplogroup T is found at moderate frequencies in modern populations across these regions, reflecting the long-standing genetic and cultural connections between Europe, the Near East, and North Africa. As a key maternal lineage, haplogroup T continues to be a focus of research in population genetics and archaeology, providing valuable insights into the migration and adaptation of ancient human populations.

Wichtige Punkte

  • Origin and Evolution
  • Subclades of Haplogroup T
  • Geographic Distribution and Significance
  • Role in Human Migration
  • Ancient DNA and Archaeological Evidence

Referenzprofil

Baum und Verwandtschaft

Phylogenetischer Kontext und Subkladen

Entwicklungsweg

Folgen Sie den erfassten übergeordneten Zweigen bis T. Die Daten sind Schätzungen und können sich ändern, wenn Referenzdaten überarbeitet werden.

Schritte Haplogruppe Altersschätzung Archäologische Epoche Vergangene Zeit Unmittelbare Nachkommen Getestete moderne Nachkommen Antike Verknüpfungen
1 T Aktuell ~27,000 years ago Paleolithic 27,000 Jahre 3 1,950 84
2 JT ~40,000 years ago Paleolithic 40,000 Jahre 2 4,094 1
3 R2'JT - - - 2 4,133 0
4 R ~55,000 years ago Paleolithic 55,000 Jahre 17 22,830 57
5 NA - - - 1 22,830 0
6 N ~60,000 years ago Paleolithic 60,000 Jahre 16 26,150 13
7 L3 ~70,000 years ago Paleolithic 70,000 Jahre 7 30,162 6
8 L3'4 - - - 2 30,212 0
9 L3'4'6 - - - 2 30,216 0
10 L2'3'4'6 - - - 2 31,333 0
11 L2'3'4'5'6'7 - - - 2 31,349 0
12 L1'2'3'4'5'6'7 - - - 2 31,852 0
13 L ~160,000 years ago Paleolithic 160,000 Jahre 2 32,236 5

Geschwisterzweige (1)

Weitere Zweige derselben übergeordneten Haplogruppe

Referenzprofil

Verbreitung weltweit

Geografische Verbreitung und moderne Präsenz

Erfasster Ursprung

The Near East, with significant dispersal into Europe and parts of Central Asia

Moderne Verbreitung

MTDNA haplogroup T is primarily found in the following populations:

  • European populations (especially in Southern, Central, and Eastern Europe)
  • Middle Eastern populations
  • Caucasus region populations
  • Some populations in North Africa
  • Jewish populations, particularly Ashkenazi Jews
  • Some populations in Central Asia
Historischer Kontext

Ein Zweig durch die Zeit

Geschätzte Entstehung in einer breiten historischen Zeitleiste. Zeitmarken liefern Kontext und implizieren keine Verbindung zu bestimmten Kulturen.

  1. ~27k Jahre zurück

    Haplogruppe T

    Geschätzte Entstehung dieses mtDNA-Zweigs; Daten und Orte sind Referenzschätzungen.

    Dieser Zweig
  2. ~20k Jahre zurück

    Letztes glaziales Maximum

    Höhepunkt der letzten Eiszeit, isolierte Bevölkerungen

  3. ~10k Jahre zurück

    Neolithische Revolution

    Beginn der Landwirtschaft und feste Siedlungen

  4. ~5k Jahre zurück

    Bronzezeit

    Metallverarbeitung, Schrift und frühe Zivilisationen

  5. ~3k Jahre zurück

    Eisenzeit

    Eisenwerkzeuge und ausgedehnte Handelsnetze

  6. ~2.5k Jahre zurück

    Klassische Antike

    Blüte griechischer und römischer Kulturen

  7. Gegenwart

    Gegenwart

    Moderne Zeit

Referenzprofil

Archäologischer Kontext

Erfasste archäologische Zuordnungen für den mtDNA-Zweig T

Erfasste Zuordnungen

Diese Bezeichnungen beschreiben archäologische Kontexte erfasster Referenzproben mit Bezug zu T. Eine Zuordnung bedeutet nicht, dass alle Träger einer Kultur angehörten oder einer bestimmten Migrationsroute folgten.

Bulgarian EBA Dali Culture Early Medieval Armenian Frälsegården Ghassulian Gonur Culture Kanai Kokcha Linear Pottery Culture Russia_Kalmykia_EMBA_Yamnaya Welsh Neolithic
Kulturzuordnungen basieren auf dem archäologischen Kontext antiker DNA-Proben und können regionale Verknüpfungen in bestimmten Zeiträumen widerspiegeln.
Referenzprofil

Probencatalog

18 direkte Träger und 66 Subkladen-Träger der Haplogruppe T

10 angezeigt · 50 passende Proben

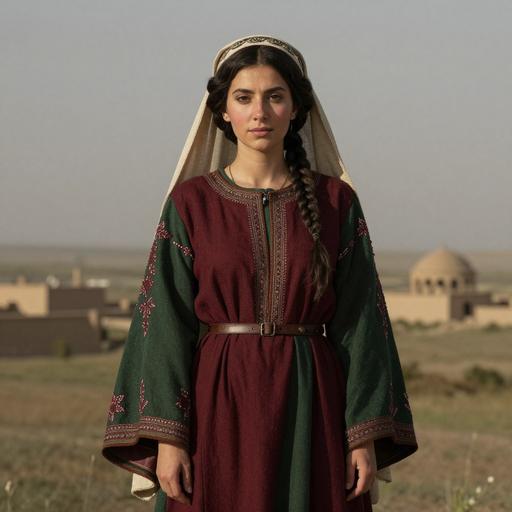
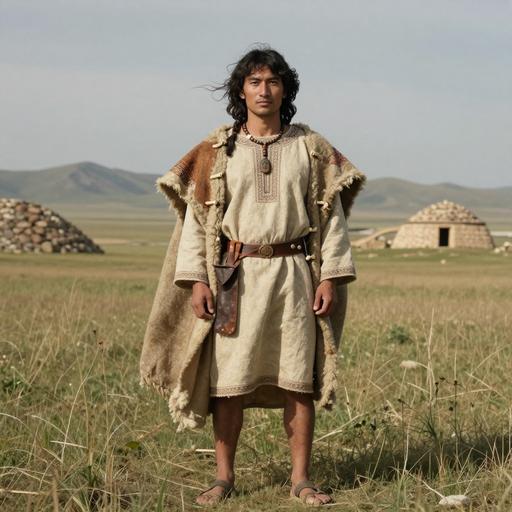
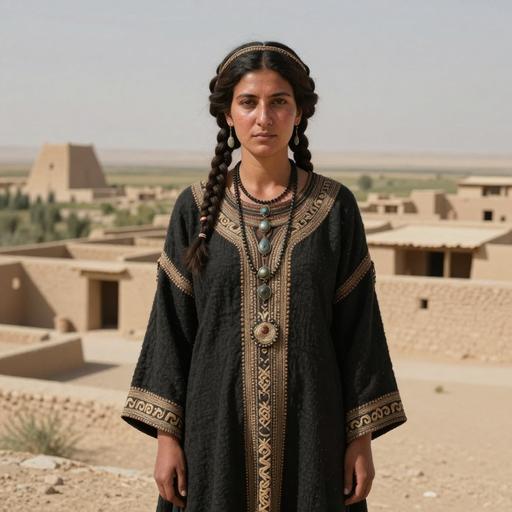
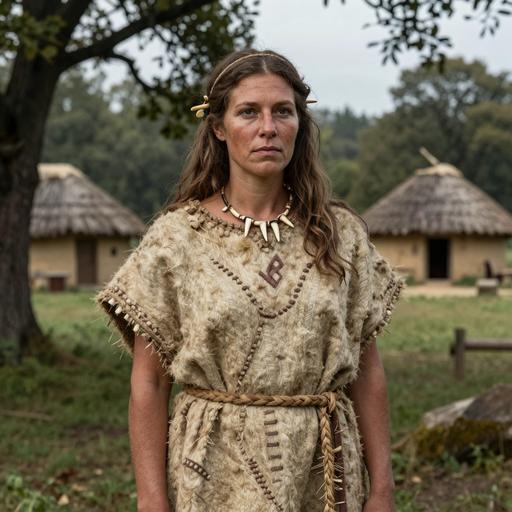
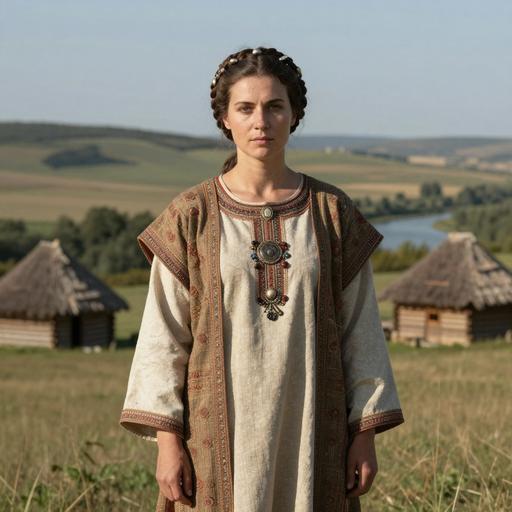
Porträts sind KI-generierte Illustrationen. Probenbezeichnungen und Zugangs-IDs identifizieren die Referenzdatensätze.

Porträt Probe Land Epoche Datum Kultur mtDNA Übereinstimmung
KI-generiertes illustratives Porträt von Lazio Imperial Roman Roman individual, ANAS (Azienda Nazionale Autonoma delle Strada), Italy (100-300 CE)
Proben-ID: R72
Italy Imperial Rome 100-300 CE Roman Empire T Direkt
KI-generiertes illustratives Porträt von IA Wielbark individual, Masłomęcz (Lublin Province, Hrubieszów County, Hrubieszów), Poland (328-431 CE)
Proben-ID: PCA0093
Poland Wielbark Culture 328-431 calCE Wielbark T Direkt
KI-generiertes illustratives Porträt von Grand Est Haut Rhin IA individual, Oberes Holzackerfeld / Echangeur Gendarmerie (2005) (Grand Est Region, Haut-Rhin Department, Colmar arrondissement, Sainte Croix en Plaine), France (450-1 BCE)
Proben-ID: SCPG2
France Iron Age Haut-Rhin Culture 450-1 BCE Haut-Rhin Culture T Direkt
KI-generiertes illustratives Porträt von Avar-o Low East Asia individual, Kunszállás-Fülöpjakab (Bács-Kiskun County, Kecskemét), Hungary (580-804 CE)
Proben-ID: KFJ046
Hungary Hungary Avar 550-850 CE Avar T Direkt
KI-generiertes illustratives Porträt von Late Avar-o High East Asia individual, Rákóczifalva-Bagi-földek (Jász-Nagykun-Szolnok Coiunty, Szolnok), Hungary (650-900 CE)
Proben-ID: RKF166
Hungary Hungary LateAvar 650-900 CE Avar Culture T Direkt
KI-generiertes illustratives Porträt von Early Medieval Slav individual, Santok (Lubusz Province, Gorzów Wielkopolski, Santok), Poland (1,000-1,200 CE)
Proben-ID: PCA0391
Poland Iron Age Santok Culture 1000-1200 CE Santok Culture T Direkt
KI-generiertes illustratives Porträt von Agarak Town Stadium Medieval individual, Agarak, Armenia (1,100-1,300 CE)
Proben-ID: I1660
Armenia Early Medieval Armenia 1100-1300 CE Early Medieval Armenian T Direkt
KI-generiertes illustratives Porträt von BA individual, Kokcha 3, Uzbekistan (1,741-1,613 BCE)
Proben-ID: I8506
Uzbekistan Bronze Age Kokcha 1741-1613 calBCE (3375±20 BP, PSUAMS-5275) Kokcha T Direkt
KI-generiertes illustratives Porträt von MLBA individual, Byan Zherek. eastern spur. Dali, Kazakhstan (1,900-1,600 BCE)
Proben-ID: I3448
Kazakhstan Mid-Late Bronze Dali 1900-1600 BCE Dali Culture T Direkt
KI-generiertes illustratives Porträt von BA1-1 individual, Gonur, Turkmenistan (2,195-2,027 BCE)
Proben-ID: I1793
Turkmenistan Bronze Age Gonur 2195-2027 calBCE (3700±20 BP, PSUAMS-2312) Gonur Culture T Direkt
MATERNAL LINEAGE · ANCIENT DNA

Ancient lineage evidence map

Follow parent clades toward this branch and explore where ancient carriers were found.

Loading ancient observations…

Markers are archaeological find locations. A dashed connector is an uncertain, proposed geographic transition between consecutive branches supported by multiple dated observations; it is not an exact travel route, birthplace or proof of direct descent. Parent-clade samples may belong to other descendant branches. Gaps remain where evidence is insufficient. Sample dates differ from haplogroup formation dates.


Referenzprofil

Trägerverteilungskarte

Geografische Verteilung von 84 antiken DNA-Proben (direkte und Subkladen-Träger von T)

Direkter Träger Subkladen-Träger
Zeitraumfilter
Alle Zeiträume
Alle Proben werden angezeigt
Referenzprofil

Zeitliche Verteilung

Verteilung der Träger über archäologische Epochen

Referenzprofil

Geografische Verteilung

Anzahlen nach erfasstem Probenland. Sie spiegeln die verfügbare Referenzauswahl wider, nicht Bevölkerungshäufigkeiten.

Referenzprofil

Verteilung Land × Epoche

Vergleichen Sie erfasste Probenanzahlen nach Ländern und archäologischen Epochen. Wählen Sie eine belegte Zelle, um eine Probe anzusehen.

Daten

Daten und Herkunft

Quellenangaben und Datenqualität

Zuletzt aktualisiert 2026-01-15

Datenquelle

Klassifikation, geschätzte Daten und geografischer Kontext spiegeln die erfassten Referenzdaten wider und können sich bei überarbeiteten Belegen ändern. Die Probenabdeckung ist ungleichmäßig; erfasste Orte und archäologische Zuordnungen begründen weder persönliche Herkunft noch kulturelle Identität.