Saltar al contenido principal
mtDNA · Materno linaje

T

mtDNA Haplogroup T

Un perfil de referencia de una rama de linaje. Compartir haplogrupos no demuestra una relación familiar ni una identidad cultural.

Perfil de referencia

Contexto de la rama

Contexto histórico de la rama de linaje mtDNA T

Haplogroup T is a mitochondrial DNA (mtDNA) haplogroup that is maternally inherited and plays a significant role in tracing the maternal ancestry of populations in Europe, the Near East, Central Asia, and North Africa. This haplogroup is a descendant of haplogroup JT, which further branches into haplogroups J and T, with haplogroup T being the focus of migration patterns and genetic studies, especially in relation to the spread of Neolithic farming communities and later historical migrations.

Origin and Evolution

Haplogroup T is believed to have originated approximately 25,000 to 30,000 years ago, likely in the Near East or Western Asia. It is a direct descendant of haplogroup JT, which itself derives from the broader haplogroup R. Haplogroup T’s emergence is closely tied to the Upper Paleolithic period, which saw significant population migrations and cultural developments, as well as to later events such as the Neolithic expansion and migrations during the Bronze Age.

Subclades of Haplogroup T

Haplogroup T is divided into several important subclades, each with distinct geographic distributions and historical significance:

  1. T1: This subclade is primarily found in Europe, the Near East, and North Africa. T1a is the most common subclade, with its presence particularly noted in European populations.

  2. T2: This is the more widespread and diverse subclade of haplogroup T, found across Europe, the Near East, and Central Asia. T2 has numerous sub-branches, indicating ancient migrations and genetic diversification, with significant frequencies in Western and Northern Europe.

Geographic Distribution and Significance

Europe

Haplogroup T is widely distributed across Europe, where it is particularly common in populations in Western, Central, and Northern Europe. Its frequency in Europe likely reflects the migration patterns of early Neolithic farmers, who spread from the Near East into Europe around 9,000 to 7,000 years ago. These early agriculturalists carried haplogroup T, among other lineages, and contributed to the genetic landscape of modern European populations.

  • Western Europe: Haplogroup T is present in countries like France, Germany, and the British Isles, where it has persisted through various historical migrations.
  • Northern Europe: T2 subclades are more common in Scandinavia and surrounding regions, reflecting migration patterns during the Bronze Age and the later Viking expansions.

Near East

Haplogroup T is also common in the Near East, where it likely originated. It is found in populations from Israel, Lebanon, Turkey, and Jordan. The Near East is a critical region for the development of agriculture, and haplogroup T’s presence here reflects its ancient roots in these early farming societies.

The spread of haplogroup T into Europe is closely tied to the movement of Neolithic farming communities from the Near East, particularly through Anatolia and into the Balkans.

Central Asia and North Africa

In Central Asia, haplogroup T is present at lower frequencies, reflecting historical migrations and trade routes that connected Europe, the Near East, and Asia. Its presence in North Africa, particularly in Berber populations, also points to ancient migratory connections between these regions and the Mediterranean basin.

Role in Human Migration

Haplogroup T is significant for understanding the Neolithic expansion, one of the most important migratory events in human history. During the Neolithic period, early farmers from the Near East migrated into Europe, bringing with them domesticated plants and animals, as well as new farming technologies. This migration, which took place around 9,000 to 7,000 years ago, had a profound impact on the genetic makeup of European populations, and haplogroup T played a key role in this process.

Later migrations, such as those during the Bronze Age and subsequent historical periods, likely contributed to the further spread of haplogroup T across Europe and into Central Asia and North Africa. The movement of peoples along ancient trade routes, such as the Silk Road, may have also facilitated the dispersal of haplogroup T into more distant regions.

Ancient DNA and Archaeological Evidence

Ancient DNA studies have identified haplogroup T in several prehistoric human remains from Neolithic and Bronze Age archaeological sites in Europe and the Near East. These findings provide direct evidence of haplogroup T’s role in the migration of early farming communities into Europe.

  • In Neolithic Europe, haplogroup T has been detected in early farming populations, particularly in Central Europe, the British Isles, and Scandinavia.
  • In the Near East, ancient DNA from early farming sites in Turkey and Israel has revealed the presence of haplogroup T, further supporting the theory that this haplogroup originated in the Near East and spread into Europe with the advent of agriculture.

Modern Distribution and Frequency

Haplogroup T is found at varying frequencies in modern populations, particularly in Europe, the Near East, and North Africa:

  • In Western and Central Europe, haplogroup T accounts for around 10% of maternal lineages, with higher frequencies in certain regions such as the British Isles and Germany.
  • In the Near East, haplogroup T is present in significant frequencies, particularly in Israel, Lebanon, and Turkey.
  • In North Africa, haplogroup T is found at lower frequencies, particularly in Berber populations, indicating ancient connections with the Mediterranean and Europe.

Genetic and Evolutionary Significance

Haplogroup T is significant for understanding the genetic history of Europe, the Near East, and North Africa. Its wide distribution and evolutionary history make it a key marker for studying ancient human migrations, particularly those associated with the Neolithic expansion and later migrations during the Bronze Age.

As one of the maternal lineages associated with the spread of farming communities from the Near East into Europe, haplogroup T reflects the complex genetic and cultural exchanges that shaped the early development of European societies. Its presence in both ancient and modern populations highlights its role in the genetic diversity of these regions.

Conclusion

Haplogroup T is a mitochondrial DNA lineage with deep historical roots in the Near East and a wide distribution across Europe, North Africa, and Central Asia. Originating around 25,000 to 30,000 years ago, haplogroup T played a significant role in the Neolithic expansion, when early agriculturalists migrated from the Near East into Europe, bringing with them farming practices that transformed human societies.

Today, haplogroup T is found at moderate frequencies in modern populations across these regions, reflecting the long-standing genetic and cultural connections between Europe, the Near East, and North Africa. As a key maternal lineage, haplogroup T continues to be a focus of research in population genetics and archaeology, providing valuable insights into the migration and adaptation of ancient human populations.

Puntos clave

  • Origin and Evolution
  • Subclades of Haplogroup T
  • Geographic Distribution and Significance
  • Role in Human Migration
  • Ancient DNA and Archaeological Evidence

Perfil de referencia

Árbol y relaciones

Contexto filogenético y subclados

Trayectoria evolutiva

Sigue las ramas superiores registradas hasta T. Las fechas son estimaciones y pueden cambiar al revisarse los datos de referencia.

Pasos Haplogrupo Antigüedad estimada Época arqueológica Tiempo transcurrido Subclados inmediatos Portadores modernos analizados Referencias antiguas
1 T Actual ~27,000 years ago Paleolithic 27,000 years 3 1,950 84
2 JT ~40,000 years ago Paleolithic 40,000 years 2 4,094 1
3 R2'JT - - - 2 4,133 0
4 R ~55,000 years ago Paleolithic 55,000 years 17 22,830 57
5 NA - - - 1 22,830 0
6 N ~60,000 years ago Paleolithic 60,000 years 16 26,150 13
7 L3 ~70,000 years ago Paleolithic 70,000 years 7 30,162 6
8 L3'4 - - - 2 30,212 0
9 L3'4'6 - - - 2 30,216 0
10 L2'3'4'6 - - - 2 31,333 0
11 L2'3'4'5'6'7 - - - 2 31,349 0
12 L1'2'3'4'5'6'7 - - - 2 31,852 0
13 L ~160,000 years ago Paleolithic 160,000 years 2 32,236 5

Ramas hermanas (1)

Otras ramas del mismo haplogrupo superior

Perfil de referencia

En el mundo

Distribución geográfica y presencia moderna

Origen registrado

The Near East, with significant dispersal into Europe and parts of Central Asia

Distribución moderna

MTDNA haplogroup T is primarily found in the following populations:

  • European populations (especially in Southern, Central, and Eastern Europe)
  • Middle Eastern populations
  • Caucasus region populations
  • Some populations in North Africa
  • Jewish populations, particularly Ashkenazi Jews
  • Some populations in Central Asia
Contexto histórico

Una rama a través del tiempo

Formación estimada en una cronología histórica amplia. Los marcadores temporales aportan contexto y no implican relación con culturas concretas.

  1. ~27k años de antigüedad

    Haplogrupo T

    Formación estimada de esta rama de mtDNA; las fechas y ubicaciones son estimaciones de referencia.

    Esta rama
  2. ~20k años de antigüedad

    Último máximo glacial

    Máxima extensión de la última glaciación y aislamiento de poblaciones

  3. ~10k años de antigüedad

    Revolución neolítica

    Inicio de la agricultura y formación de comunidades sedentarias

  4. ~5k años de antigüedad

    Edad del Bronce

    Metalurgia, escritura y primeras civilizaciones

  5. ~3k años de antigüedad

    Edad del Hierro

    Herramientas de hierro y ampliación de redes comerciales

  6. ~2.5k años de antigüedad

    Antigüedad clásica

    Desarrollo de las civilizaciones griega y romana

  7. Actualidad

    Actualidad

    Época moderna

Perfil de referencia

Contexto arqueológico

Asociaciones arqueológicas registradas para la rama mtDNA T

Asociaciones registradas

Estas etiquetas describen contextos arqueológicos registrados para las muestras de referencia enlazadas a T. Una asociación no demuestra que todos los portadores pertenecieran a una cultura ni siguieran una ruta migratoria concreta.

Bulgarian EBA Dali Culture Early Medieval Armenian Frälsegården Ghassulian Gonur Culture Kanai Kokcha Linear Pottery Culture Russia_Kalmykia_EMBA_Yamnaya Welsh Neolithic
Las atribuciones culturales se basan en el contexto arqueológico de las muestras de ADN antiguo y pueden representar asociaciones regionales de periodos concretos.
Perfil de referencia

Catálogo de muestras

18 portadores directos y 66 portadores de subclados del haplogrupo T

10 mostradas · 50 muestras coincidentes

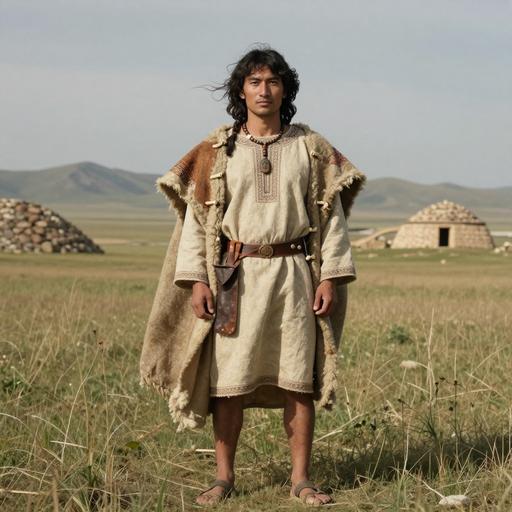
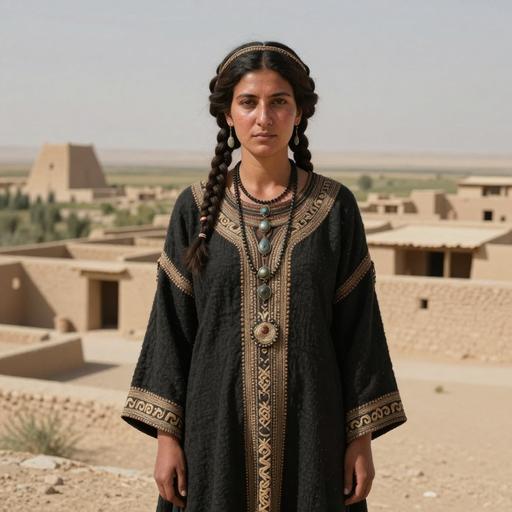
Los retratos son ilustraciones generadas con IA. Las etiquetas de muestra y los identificadores de acceso identifican los registros de referencia.

Retrato Muestra País Época Fecha Cultura mtDNA Coincidencia
Retrato ilustrativo de Lazio Imperial Roman Roman individual, ANAS (Azienda Nazionale Autonoma delle Strada), Italy (100-300 CE) generado con IA
Identificador de muestra: R72
Italy Imperial Rome 100-300 CE Roman Empire T Direct
Retrato ilustrativo de IA Wielbark individual, Masłomęcz (Lublin Province, Hrubieszów County, Hrubieszów), Poland (328-431 CE) generado con IA
Identificador de muestra: PCA0093
Poland Wielbark Culture 328-431 calCE Wielbark T Direct
Retrato ilustrativo de Grand Est Haut Rhin IA individual, Oberes Holzackerfeld / Echangeur Gendarmerie (2005) (Grand Est Region, Haut-Rhin Department, Colmar arrondissement, Sainte Croix en Plaine), France (450-1 BCE) generado con IA

Identificador de muestra: SCPG2

France Iron Age Haut-Rhin Culture 450-1 BCE Haut-Rhin Culture T Direct
Retrato ilustrativo de Avar-o Low East Asia individual, Kunszállás-Fülöpjakab (Bács-Kiskun County, Kecskemét), Hungary (580-804 CE) generado con IA
Identificador de muestra: KFJ046
Hungary Hungary Avar 550-850 CE Avar T Direct
Retrato ilustrativo de Late Avar-o High East Asia individual, Rákóczifalva-Bagi-földek (Jász-Nagykun-Szolnok Coiunty, Szolnok), Hungary (650-900 CE) generado con IA
Identificador de muestra: RKF166
Hungary Hungary LateAvar 650-900 CE Avar Culture T Direct
Retrato ilustrativo de Early Medieval Slav individual, Santok (Lubusz Province, Gorzów Wielkopolski, Santok), Poland (1,000-1,200 CE) generado con IA
Identificador de muestra: PCA0391
Poland Iron Age Santok Culture 1000-1200 CE Santok Culture T Direct
Retrato ilustrativo de Agarak Town Stadium Medieval individual, Agarak, Armenia (1,100-1,300 CE) generado con IA
Identificador de muestra: I1660
Armenia Early Medieval Armenia 1100-1300 CE Early Medieval Armenian T Direct
Retrato ilustrativo de BA individual, Kokcha 3, Uzbekistan (1,741-1,613 BCE) generado con IA
Identificador de muestra: I8506
Uzbekistan Bronze Age Kokcha 1741-1613 calBCE (3375±20 BP, PSUAMS-5275) Kokcha T Direct
Retrato ilustrativo de MLBA individual, Byan Zherek. eastern spur. Dali, Kazakhstan (1,900-1,600 BCE) generado con IA
Identificador de muestra: I3448
Kazakhstan Mid-Late Bronze Dali 1900-1600 BCE Dali Culture T Direct
Retrato ilustrativo de BA1-1 individual, Gonur, Turkmenistan (2,195-2,027 BCE) generado con IA
Identificador de muestra: I1793
Turkmenistan Bronze Age Gonur 2195-2027 calBCE (3700±20 BP, PSUAMS-2312) Gonur Culture T Direct
MATERNAL LINAJE · ADN ANTIGUO

Mapa de pruebas de linajes antiguos

Sigue los clados superiores hasta esta rama y explora dónde se encontraron portadores antiguos.

Cargando observaciones antiguas...

Los marcadores son ubicaciones de hallazgos arqueológicos. Una línea discontinua representa una transición geográfica propuesta e incierta entre ramas consecutivas, apoyada en varias observaciones fechadas; no es una ruta de viaje exacta, un lugar de nacimiento ni una prueba de descendencia directa. Las muestras del clado parental pueden pertenecer a otras ramas descendientes. Se mantienen huecos cuando las pruebas son insuficientes. Las fechas de las muestras son distintas de las fechas de formación de los haplogrupos.

Perfil de referencia

Mapa de distribución de portadores

Distribución geográfica de muestras de ADN antiguo (84), portadores directos o de subclados de T

Portador directo Portador de un subclado
Filtro de periodo temporal
Todos los periodos
Mostrando todas las muestras
Perfil de referencia

Distribución temporal

Distribución de portadores por periodos arqueológicos

Perfil de referencia

Distribución geográfica

Recuentos por país registrado de las muestras. Reflejan la selección de referencia disponible, no frecuencias de población.

Perfil de referencia

Distribución por país y época

Compara los recuentos de muestras registradas por países y periodos arqueológicos. Selecciona una celda con datos para examinar una muestra.

Datos

Datos y procedencia

Información sobre las fuentes y la calidad de los datos

Última actualización 2026-01-15

Fuente de datos

La clasificación, las fechas estimadas y el contexto geográfico reflejan los datos de referencia registrados y pueden cambiar al revisarse las pruebas. La cobertura de muestras es desigual; las ubicaciones registradas y las asociaciones arqueológicas no establecen el origen personal ni la identidad cultural.