Aller au contenu principal
mtDNA · lignée Maternelle

Q1

mtDNA Haplogroup Q1

Profil de référence pour une branche de lignée. Des haplogroupes partagés n'établissent pas de lien familial ni d'identité culturelle.

Profil de référence

Contexte de la branche

Contexte historique de la branche de lignée mtDNA Q1

Origins and Evolution

mtDNA haplogroup Q1 is a subclade of haplogroup Q (itself a descendant of the macro-haplogroup R/N lineage that expanded out of Eurasia). The parent clade Q diversified early during the settlement of Sahul and Near Oceania. Based on the phylogenetic position of Q and coalescence estimates for Q sublineages, Q1 most likely arose in Near Oceania around the Late Pleistocene (~25–40 kya, here provisionally dated at ~30 kya). This timing and geography are consistent with the deep maternal lineages that accompanied the first modern human colonists of New Guinea, the Bismarck Archipelago and nearby islands.

Because Q1 sits within a regional radiation of deep Oceanian mtDNA lineages, its origin reflects local differentiation after the initial colonization of Sahul rather than a late Holocene introduction.

Subclades (if applicable)

Q1 is an intermediate node in the Q phylogeny and can include downstream subclades (often annotated in Phylotree-style nomenclature as Q1a, Q1b, etc., depending on the resolution of sequencing and nomenclature updates). Many of these downstream branches are still being characterized; some apparent subclades are currently defined by limited modern samples or single-population discoveries. High-resolution complete-mitochondrial-genome surveys and ancient DNA sampling are gradually resolving the fine structure of Q1 and its daughter clades.

Geographical Distribution

Primary concentrations of Q1 are in Near Oceania — notably diverse in New Guinea and the surrounding islands (Bismarcks, Solomon Islands, portions of the Admiralty Islands). Lower-frequency occurrences are reported in parts of Island Southeast Asia (including some Papuan-speaking and Austronesian-speaking communities), and occasional presence among Indigenous Australian samples has been reported in regionally specific surveys. The distribution pattern is typical of a Pleistocene-derived maternal lineage that persisted locally through the Holocene and experienced varying degrees of admixture with incoming Austronesian groups.

Historical and Cultural Significance

Q1 reflects the maternal legacy of the early settlers of Sahul and their descendants. In Near Oceania, ancient demographic continuity is high in many interior and highland regions of New Guinea; therefore, Q1 and related lineages often mark long-term local ancestry (frequently associated with Papuan-speaking hunter-gatherer and horticulturalist traditions). During the Holocene, Austronesian expansions (and associated Lapita cultural horizons) introduced new maternal lineages (for example, B4a-derived lineages) into coastal and island populations, but Q1 often persisted in Papuan populations and in island groups with substantial Papuan admixture. Ancient DNA studies from the region increasingly show continuity of deep mtDNA lineages like Q across millennia, underlining their importance for reconstructing the peopling and demographic history of Near Oceania.

Conclusion

mtDNA haplogroup Q1 is a deep, regionally important maternal lineage tied to the initial colonization and long-term population history of Near Oceania. While broad-brush patterns are clear — deep Pleistocene origin in and around New Guinea, persistence through the Holocene, and presence today in Melanesian and some nearby populations — the internal structure and finer geographic details of Q1 require more complete-mitochondrial-genome surveys and additional ancient DNA sampling to resolve subclade relationships and precise timings.

Points clés

  • Origins and Evolution
  • Subclades (if applicable)
  • Geographical Distribution
  • Historical and Cultural Significance
  • Conclusion
Profil de référence

Arbre et relations

Contexte phylogénétique et sous-clades

Voie évolutive

Suivez les branches parentes consignées jusqu'à Q1. Les dates sont des estimations et peuvent évoluer lorsque les données de référence sont révisées.

Étapes Haplogroupe Âge estimé Époque archéologique Temps écoulé Descendants immédiats Descendants modernes testés Liens anciens
1 Q1 Actuel ~30,000 years ago Paleolithic 30,000 ans 2 1 0
2 Q1'2 - - - 2 2 0
3 Q ~35,000 years ago Paleolithic 35,000 ans 1 6 4
4 M29'Q - - - 2 6 0
5 M ~60,000 years ago Paleolithic 60,000 ans 42 2,671 41
6 L3 ~70,000 years ago Paleolithic 70,000 ans 7 30,162 6
7 L3'4 - - - 2 30,212 0
8 L3'4'6 - - - 2 30,216 0
9 L2'3'4'6 - - - 2 31,333 0
10 L2'3'4'5'6'7 - - - 2 31,349 0
11 L1'2'3'4'5'6'7 - - - 2 31,852 0
12 L ~160,000 years ago Paleolithic 160,000 ans 2 32,236 5

Branches sœurs (1)

Autres branches issues du même haplogroupe parent

Profil de référence

Dans le monde

Distribution géographique et présence moderne

Origine consignée

Near Oceania (New Guinea)

Distribution moderne

The populations where mtDNA haplogroup Q1 is found include:

  1. Papuan-speaking populations of New Guinea (highland and lowland groups)
  2. Bismarck Archipelago island populations
  3. Solomon Islands populations
  4. Some coastal and island populations in eastern Indonesia (Island Southeast Asia)
  5. Select Indigenous Australian groups (regionally limited reports)
  6. Austronesian-speaking island communities with Papuan admixture (e.g., parts of Near Oceania)
Contexte historique

Une branche dans le temps

Formation estimée sur une chronologie historique large. Les repères de période servent de contexte et n'impliquent pas de lien avec des cultures particulières.

  1. Il y a ~30k ans

    Haplogroupe Q1

    Formation estimée de cette branche mtDNA ; les dates et les lieux sont des estimations de référence.

    Cette branche
  2. Il y a ~20k ans

    Dernier maximum glaciaire

    Apogée de la dernière période glaciaire, populations isolées

  3. Il y a ~10k ans

    Révolution néolithique

    Début de l'agriculture et émergence de communautés sédentaires

  4. Il y a ~5k ans

    Âge du bronze

    Travail des métaux, écriture et premières civilisations

  5. Il y a ~3k ans

    Âge du fer

    Outils en fer, réseaux d'échanges élargis

  6. Il y a ~2.5k ans

    Antiquité classique

    Floraison des civilisations grecque et romaine

  7. Aujourd'hui

    Aujourd'hui

    Époque moderne

Profil de référence

Contexte archéologique

Associations archéologiques consignées pour la branche mtDNA Q1

Associations consignées

Ces libellés décrivent des contextes archéologiques consignés pour des échantillons de référence liés à Q1. Une association n'établit pas que tous les porteurs appartenaient à une culture ni qu'ils ont suivi une route migratoire précise.

Early Bronze Indonesian Early Lapita Vanuatu Indonesia_950BP_Sulawesi Late Vanuatu Polynesian Vanuatu Post-Lapita Vanuatu Tanjung Pinang Culture
Les attributions culturelles reposent sur le contexte archéologique des échantillons d'ADN ancien et peuvent refléter des associations régionales à certaines périodes.
Profil de référence

Catalogue d'échantillons

3 porteurs directs et 3 porteurs de sous-clade de l'haplogroupe Q1

6 affiché(s) · 6 échantillons correspondants

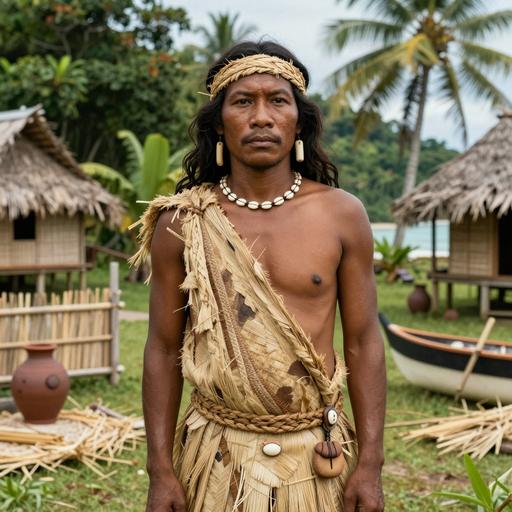
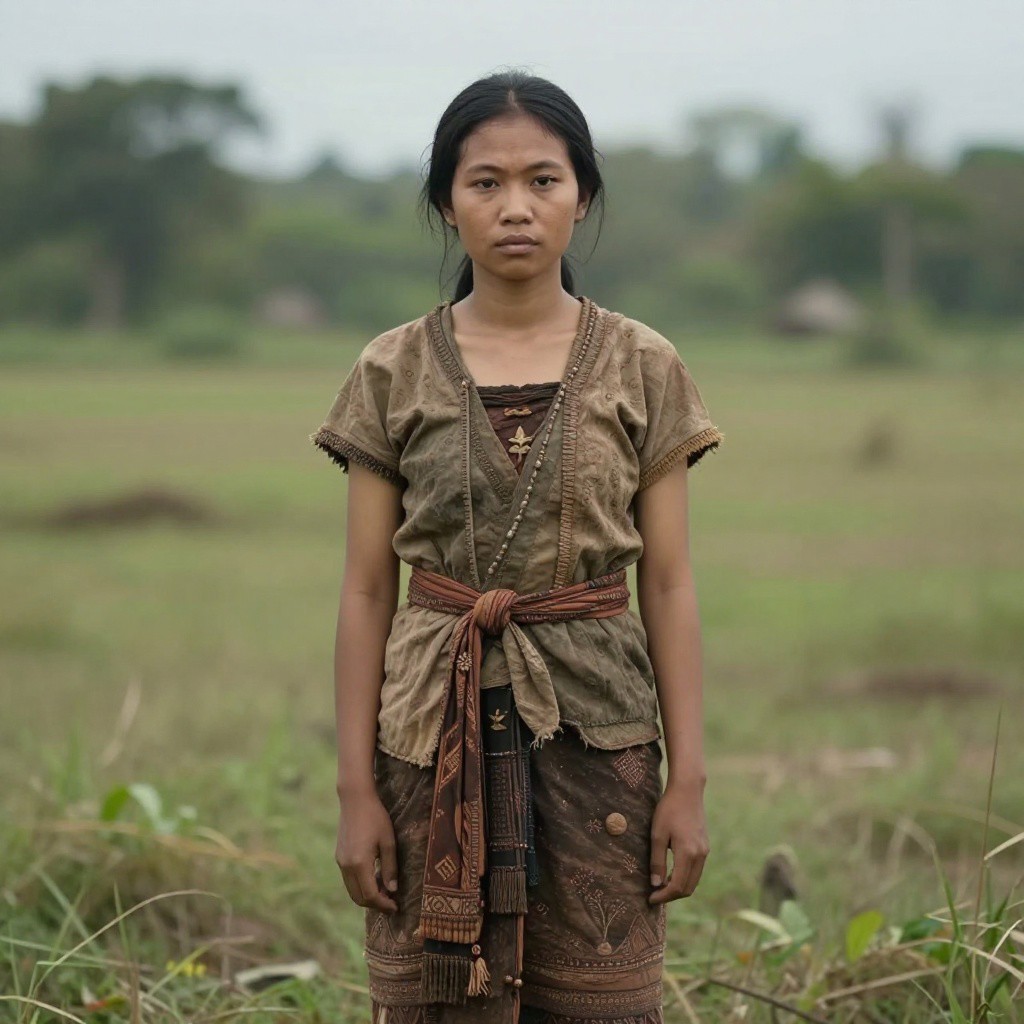
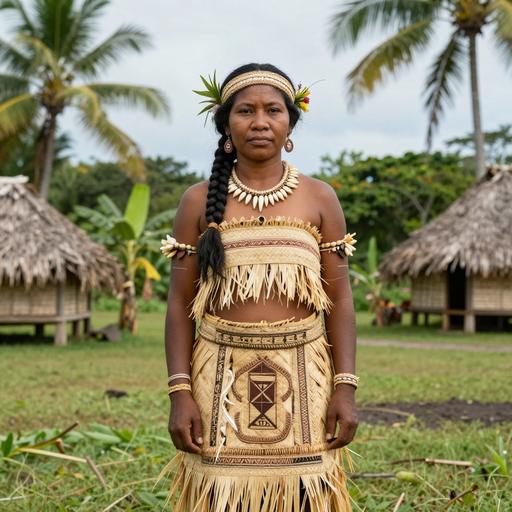
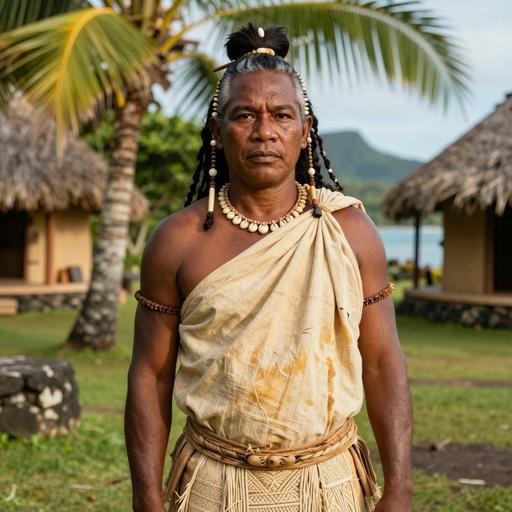
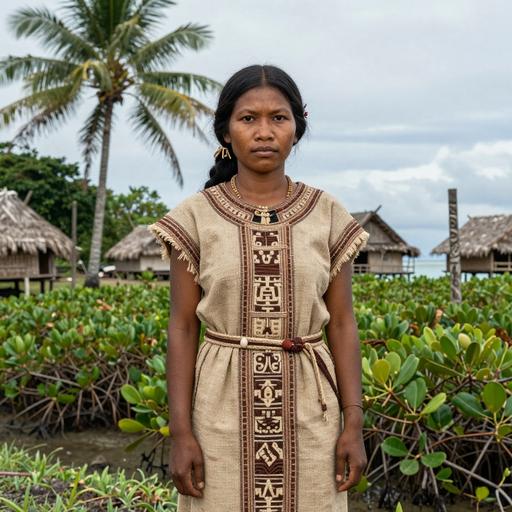
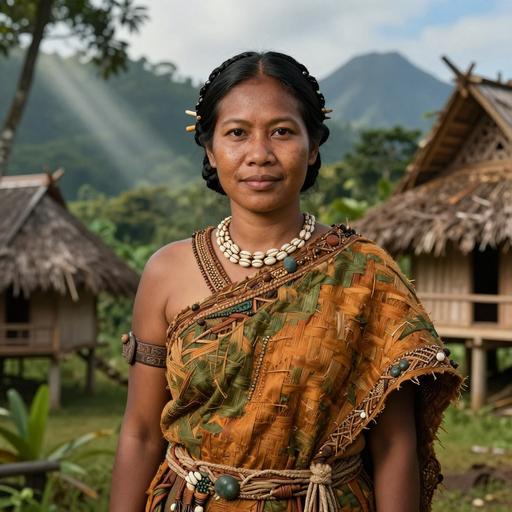
Les portraits sont des illustrations générées par IA. Les libellés d'échantillon et identifiants d'accès désignent les enregistrements de référence.

Portrait Échantillon Pays Époque Date Culture mtDNA Correspondance
Portrait illustratif généré par IA de N EBA individual, North Moluccas. Morotai. Tanjung Pinang, Indonesia (750 BCE-350 CE)
Identifiant d'échantillon : TanjungPinang2
Indonesia Neolithic to Early Bronze Age Tanjung Pinang, Morotai, Indonesia 750 BCE - 350 CE Tanjung Pinang Culture Q1 Direct
Portrait illustratif généré par IA de Sulawesi individual, Gua Talimbue (Southeast Sulawesi, Walandwe), Indonesia (892-1,008 CE)
Identifiant d'échantillon : I20618
Indonesia Indonesia 950BP Sulawesi 900-1000 CE Indonesia_950BP_Sulawesi Q1 Direct
Portrait illustratif généré par IA de 400 BP-o individual, Efate. Mangaasi, Vanuatu (1,450-1,650 CE)
Identifiant d'échantillon : I10966
Vanuatu Vanuatu 400BP 1450-1650 CE Late Vanuatu Q1 Direct
Portrait illustratif généré par IA de Austronesian individual, Efate. Mele-Taplins, Vanuatu (600-300 BCE)
Identifiant d'échantillon : I6188
Vanuatu Vanuatu 2400BP 600-300 BCE Post-Lapita Vanuatu Q1b Sous-clade
Portrait illustratif généré par IA de EBA individual, North Moluccas. Morotai. Aru Manara, Indonesia (750 BCE-150 CE)
Identifiant d'échantillon : AMA003008
Indonesia Early Bronze Age Indonesia 750 BCE - 150 CE Early Bronze Indonesian Q1d Sous-clade
Portrait illustratif généré par IA de EBA individual, North Moluccas. Morotai. Aru Manara, Indonesia (1,025-1,156 CE)
Identifiant d'échantillon : AMA009
Indonesia Early Bronze Age Indonesia 1025-1156 calCE (968±20 BP, MAMS-38994/Otago-1046) Early Bronze Indonesian Q1d Sous-clade
LIGNÉE MATERNELLE · ADN ANTIQUE

Carte des preuves de lignées antiques

Suivez les clades parents jusqu'à cette branche et explorez où des porteurs antiques ont été identifiés.

Chargement des observations antiques…

Les marqueurs indiquent des lieux de découvertes archéologiques. Un trait pointillé représente une transition géographique proposée et incertaine entre branches consécutives, appuyée sur plusieurs observations datées ; ce n'est pas un itinéraire exact, un lieu de naissance ni une preuve de descendance directe. Des échantillons de clades parents peuvent appartenir à d'autres branches descendantes. Des lacunes subsistent lorsque les preuves sont insuffisantes. Les dates d'échantillon diffèrent des dates de formation des haplogroupes.

Profil de référence

Carte de répartition des porteurs

Répartition géographique de 6 échantillons d'ADN ancien (porteurs directs et de sous-clade de Q1)

Porteur direct Porteur de sous-clade
Filtre de période
Toutes les périodes
Affichage de tous les échantillons
Profil de référence

Répartition temporelle

Répartition des porteurs selon les périodes archéologiques

Profil de référence

Répartition géographique

Effectifs par pays d'échantillon consigné. Ils reflètent la sélection de référence disponible, pas des fréquences de population.

Profil de référence

Répartition pays × époque

Comparez les effectifs d'échantillons consignés selon les pays et les périodes archéologiques. Sélectionnez une cellule renseignée pour examiner un échantillon.

Données

Données et provenance

Informations sur les sources et qualité des données

Dernière mise à jour 2026-06-14
Score de confiance 50/100
Couverture Low

Source des données

La classification, les dates estimées et le contexte géographique reflètent les données de référence consignées et peuvent évoluer lorsque les éléments sont révisés. La couverture d'échantillons est inégale ; les lieux consignés et les associations archéologiques n'établissent pas une origine personnelle ni une identité culturelle.