mtDNA · Maternal lineage

L2D1

mtDNA Haplogroup L2D1

A reference profile for one lineage branch. Shared haplogroups do not establish a family relationship or cultural identity.

Reference profile

Branch background

Historical context for mtDNA lineage branch L2D1

Origins and Evolution

mtDNA haplogroup L2D1 belongs to the broader L2 family, a diverse and widespread maternal lineage within sub-Saharan Africa. The L2 clade is one of the major African mtDNA branches and shows deep time depth in West and Central Africa. As a derived subclade (placed beneath L2D / L2DA in current phylogenies), L2D1 likely arose during the transition from the Late Pleistocene into the Holocene as regional populations diversified in West/Central Africa. Date estimates for L2 sublineages vary in the literature, and for L2D1 a conservative estimate places its origin on the order of ~10 thousand years ago (kya), though this is provisional and will be refined as more complete mitogenomes are sampled and dated.

Subclades (if applicable)

L2D1 is an intermediate/terminal clade within the L2D branch. The internal structure of L2D1 (its immediate subclades) is still incompletely resolved in public reference trees and is subject to revision as additional full mitochondrial genomes are published. In many cases, sub-branches of L2D1 appear at low frequencies and show localized patterns consistent with micro-regional population structure in West and Central Africa.

Geographical Distribution

L2D1 is principally associated with West and parts of Central Africa. Published and unpublished population surveys indicate detections of L2D-lineage variants, including L2D1, among coastal and interior West African groups (for example communities sampled in the Gulf of Guinea and the forest-savanna mosaic). Frequencies are typically low to moderate at a regional scale, and specific high-frequency pockets have not been consistently reported. Due to the trans-Atlantic slave trade and more recent migrations, L2D1 (like other L2 subclades) can also be found at low frequencies in the Americas and Caribbean among populations of African descent.

Historical and Cultural Significance

While not tied to a single archaeological culture, the distribution and age of L2D1 are compatible with demographic processes that shaped Holocene West African populations. These include post-glacial population re-expansions, localized movements associated with the development of food production, and later large-scale events such as the Bantu-associated dispersals (which strongly affected the spread of some L2 subclades) and the trans-Atlantic slave trade, which introduced West African maternal lineages into the Americas. L2D1 itself appears to have been a low-frequency but persistent component of maternal diversity in the region rather than a marker of a single migratory wave.

Conclusion

L2D1 is a West/Central African mtDNA subclade nested within the diverse L2 family. Current evidence points to an origin in the early Holocene with a distribution concentrated in West and Central Africa and detectable, at low levels, in the African diaspora. The haplogroup's internal diversity and precise chronology remain under active study; more complete mitogenome sampling across understudied West African populations will improve resolution of L2D1's phylogeny, chronology, and micro-geographic patterns.

Key Points

  • Origins and Evolution
  • Subclades (if applicable)
  • Geographical Distribution
  • Historical and Cultural Significance
  • Conclusion
Reference profile

Tree & Relationships

Phylogenetic context and subclades

Evolution Path

Follow the recorded parent branches toward L2D1. Dates are estimates and can change as reference data is revised.

Steps Haplogroup Age Estimate Archaeology Era Time Passed Immediate Descendants Tested Modern Descendants Ancient Connections
1 L2D1 Current ~10,000 years ago Neolithic 10,000 years 1 18 0
2 L2DA - - - 1 18 0
3 L2D ~40,000 years ago Paleolithic 40,000 years 1 31 0
4 L2B'C'D - - - 2 242 0
5 L2A'B'C'D - - - 2 989 0
6 L2 ~70,000 years ago Paleolithic 70,000 years 4 1,045 7
7 L2'3'4'6 - - - 2 31,333 0
8 L2'3'4'5'6'7 - - - 2 31,349 0
9 L1'2'3'4'5'6'7 - - - 2 31,852 0
10 L ~160,000 years ago Paleolithic 160,000 years 2 32,236 5
Reference profile

Where in the World

Geographic distribution and modern presence

Recorded origin

West/Central Africa

Modern Distribution

The populations where mtDNA haplogroup L2D1 is found include:

  1. Yoruba (Nigeria)
  2. Mende (Sierra Leone)
  3. Akan (Ghana)
  4. Igbo (Nigeria)
  5. Mandinka (West Africa / Senegambia)
  6. Fulani / Fula (Sahelian and West African groups)
  7. African American populations (North America, low frequency)
  8. Afro-Caribbean populations (Caribbean islands, low frequency)
Historical context

A branch through time

Estimated formation in a broad historical timeline. Period markers provide context and do not imply a connection with particular cultures.

  1. ~10k years ago

    Neolithic Revolution

    Agriculture begins, settled communities form

  2. ~10k years ago

    Haplogroup L2D1

    Estimated formation of this mtDNA branch; dates and locations are reference estimates.

    This branch
  3. ~5k years ago

    Bronze Age

    Metalworking, writing, and early civilizations

  4. ~3k years ago

    Iron Age

    Iron tools, expanded trade networks

  5. ~2.5k years ago

    Classical Antiquity

    Greek and Roman civilizations flourish

  6. Present

    Present Day

    Modern era

Reference profile

Archaeological context

Recorded archaeological associations for mtDNA branch L2D1

Recorded associations

These labels describe archaeological contexts recorded for reference samples linked to L2D1. An association does not establish that all carriers belonged to a culture or followed a particular migration route.

Corded Ware El Argar Jordanow-Michelsberg Culture Kansyore Culture Manda Modern Period St. Helena Colonial Unetice Culture
Culture assignments are based on archaeological context of ancient DNA samples and may represent regional associations during specific time periods.
Reference profile

Sample Catalog

4 subclade carriers of haplogroup L2D1 (no direct carriers in the current reference selection)

4 shown · 4 matching samples

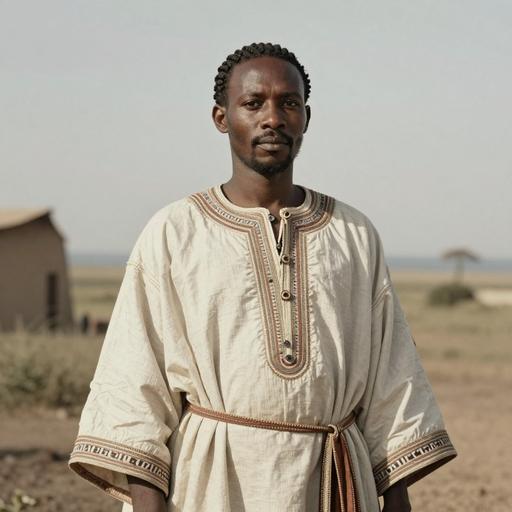
Portraits are AI-generated illustrations. Sample labels and accession IDs identify the reference records.

Portrait Sample Country Era Date Culture mtDNA Match
AI-generated illustrative portrait of Swahili individual, Manda (Lamu), Kenya (1,400-1,700 CE)
Sample ID: I7943
Kenya Swahili Culture of Manda Island 1400-1650 CE Manda L2d1a Subclade
AI-generated illustrative portrait of Swahili individual, Manda (Lamu), Kenya (1,400-1,700 CE)
Sample ID: I19407
Kenya Swahili Culture of Manda Island 1400-1650 CE Manda L2d1a Subclade
AI-generated illustrative portrait of Swahili individual, Manda (Lamu), Kenya (1,456-1,621 CE)
Sample ID: I7934
Kenya Swahili Culture of Manda Island 1456-1621 calCE (410±15 BP, PSUAMS-5511) Manda L2d1a Subclade
AI-generated illustrative portrait of Swahili individual, Manda (Lamu), Kenya (1,457-1,626 CE)
Sample ID: I7942
Kenya Swahili Culture of Manda Island 1457-1626 calCE (395±20 BP, PSUAMS-5515) Manda L2d1a Subclade
MATERNAL LINEAGE · ANCIENT DNA

Ancient lineage evidence map

Follow parent clades toward this branch and explore where ancient carriers were found.

Loading ancient observations…

Markers are archaeological find locations. A dashed connector is an uncertain, proposed geographic transition between consecutive branches supported by multiple dated observations; it is not an exact travel route, birthplace or proof of direct descent. Parent-clade samples may belong to other descendant branches. Gaps remain where evidence is insufficient. Sample dates differ from haplogroup formation dates.

Reference profile

Carrier Distribution Map

Geographic distribution of 4 ancient DNA samples (direct and subclade carriers of L2D1)

Subclade carrier
Time Period Filter
All Time Periods
Showing all samples
Reference profile

Temporal Distribution

Distribution of carriers across archaeological periods

Reference profile

Geographic Distribution

Counts by recorded sample country. These reflect the available reference selection, not population frequencies.

Reference profile

Country × Era Distribution

Compare recorded sample counts across countries and archaeological periods. Select a populated cell to inspect a sample.

Data

Data & Provenance

Source information and data quality

Last Updated 2026-06-14
Confidence Score 50/100
Coverage Low

Data Source

Classification, estimated dates and geographic context reflect the recorded reference data and may change as evidence is revised. Sample coverage is uneven; recorded locations and archaeological associations do not establish personal origin or cultural identity.