mtDNA · Maternal lineage

M3A

mtDNA Haplogroup M3A

A reference profile for one lineage branch. Shared haplogroups do not establish a family relationship or cultural identity.

Reference profile

Branch background

Historical context for mtDNA lineage branch M3A

Origins and Evolution

mtDNA haplogroup M3A is a derived subclade of haplogroup M3, itself a member of the macro-haplogroup M. M3 has been characterized as a predominantly South Asian lineage that likely arose in the Late Pleistocene (~25 kya). M3A represents one of the downstream branches that diversified within South Asia during the early Holocene (post-glacial period), reflecting local maternal diversification and demographic processes such as population continuity and regional expansions after the Last Glacial Maximum. The estimated time depth for M3A (on the order of ~8–12 kya) aligns with known Holocene demographic changes in the subcontinent, including the spread and intensification of foraging and early farming practices in parts of South Asia.

Subclades

As an intermediate clade of M3, M3A typically shows limited but detectable internal structure in high-resolution sequencing studies; some datasets resolve minor downstream branches (often labelled with additional alphanumeric suffixes in full phylogenies). In many population surveys based on HVS-I or partial coding-region data, M3A is treated as a single recognizable haplogroup because deep internal branching has been modest compared with older macro-haplogroups. Ongoing mitogenome sequencing continues to refine its internal topology and to identify low-frequency subbranches.

Geographical Distribution

M3A is concentrated in the Indian subcontinent, where its highest frequencies and diversity are observed, consistent with an in-situ origin and long-term presence. It is found across a broad set of groups including tribal populations and caste groups, and is also observed in Sri Lanka and parts of Pakistan, Bangladesh and Nepal. Low-frequency occurrences in Central Asia and Southeast Asia, and in island communities around the Indian Ocean, are best interpreted as later gene flow out of South Asia rather than independent origins. A small number of ancient South Asian individuals sequenced to date carry M3 or downstream lineages, supporting continuity of maternal lineages in the region from the Holocene to the present.

Historical and Cultural Significance

Because M3A is rooted within a South Asian radiation of mtDNA lineages, it is informative about maternal ancestry and demographic history within the subcontinent. Its presence in both tribal and caste populations indicates that the lineage predates many recent social stratifications and has been carried by multiple cultural groups over millennia. The timing of M3A diversification overlaps with archaeological horizons such as the early Holocene Neolithic sites in South Asia (e.g., Mehrgarh) and later with the growth of complex societies in the Bronze Age (e.g., the Indus Civilization), although M3A is not diagnostic of any single archaeological culture. Low-frequency occurrences outside South Asia reflect historical movements — trade, migration, and localized gene flow — rather than primary dispersal from those regions.

Conclusion

M3A is a regionally important maternal lineage for reconstructing South Asian population history. As a subclade of M3, it documents postglacial maternal diversification within the subcontinent and serves as a marker of deep local ancestry found across tribal and caste groups. Continued whole-mitogenome sequencing and integration with ancient DNA will further clarify its substructure, age estimates, and precise role in Holocene demographic events in South Asia.

Key Points

  • Origins and Evolution
  • Subclades
  • Geographical Distribution
  • Historical and Cultural Significance
  • Conclusion
Reference profile

Tree & Relationships

Phylogenetic context and subclades

Evolution Path

Follow the recorded parent branches toward M3A. Dates are estimates and can change as reference data is revised.

Steps Haplogroup Age Estimate Archaeology Era Time Passed Immediate Descendants Tested Modern Descendants Ancient Connections
1 M3A Current ~9,000 years ago Neolithic 9,000 years 2 72 7
2 M3 ~25,000 years ago Paleolithic 25,000 years 4 95 3
3 M ~60,000 years ago Paleolithic 60,000 years 42 2,671 41
4 L3 ~70,000 years ago Paleolithic 70,000 years 7 30,162 6
5 L3'4 - - - 2 30,212 0
6 L3'4'6 - - - 2 30,216 0
7 L2'3'4'6 - - - 2 31,333 0
8 L2'3'4'5'6'7 - - - 2 31,349 0
9 L1'2'3'4'5'6'7 - - - 2 31,852 0
10 L ~160,000 years ago Paleolithic 160,000 years 2 32,236 5

Siblings (3)

Other branches from the same parent haplogroup

Reference profile

Where in the World

Geographic distribution and modern presence

Recorded origin

South Asia

Modern Distribution

The populations where mtDNA haplogroup M3A is found include:

  1. Various South Asian populations (tribal groups and caste populations across India)
  2. Sri Lankan populations (Tamil and Sinhalese groups)
  3. Pakistani populations (selected groups in Punjab, Sindh and adjoining regions)
  4. Bangladeshi populations (low to moderate frequencies in some groups)
  5. Nepalese and Himalayan highland populations (sporadic occurrences)
  6. Central Asian populations (low frequency, typically due to gene flow)
  7. Southeast Asian groups (rare occurrences in Myanmar/Thailand region)
  8. Regional island populations in the Indian Ocean rim (low frequency)
  9. Modern diaspora populations in Europe and the Americas (very low frequency)
  10. Ancient South Asian archaeological individuals (identified in a small number of aDNA samples)
Historical context

A branch through time

Estimated formation in a broad historical timeline. Period markers provide context and do not imply a connection with particular cultures.

  1. ~10k years ago

    Neolithic Revolution

    Agriculture begins, settled communities form

  2. ~9k years ago

    Haplogroup M3A

    Estimated formation of this mtDNA branch; dates and locations are reference estimates.

    This branch
  3. ~5k years ago

    Bronze Age

    Metalworking, writing, and early civilizations

  4. ~3k years ago

    Iron Age

    Iron tools, expanded trade networks

  5. ~2.5k years ago

    Classical Antiquity

    Greek and Roman civilizations flourish

  6. Present

    Present Day

    Modern era

Reference profile

Archaeological context

Recorded archaeological associations for mtDNA branch M3A

Recorded associations

These labels describe archaeological contexts recorded for reference samples linked to M3A. An association does not establish that all carriers belonged to a culture or followed a particular migration route.

Barikot Butkara Culture Caishichang Culture Goyet Cave Gravettian Hetian Culture Jierzankale Culture Roopkund Culture Singoor
Culture assignments are based on archaeological context of ancient DNA samples and may represent regional associations during specific time periods.
Reference profile

Sample Catalog

7 subclade carriers of haplogroup M3A (no direct carriers in the current reference selection)

7 shown · 7 matching samples

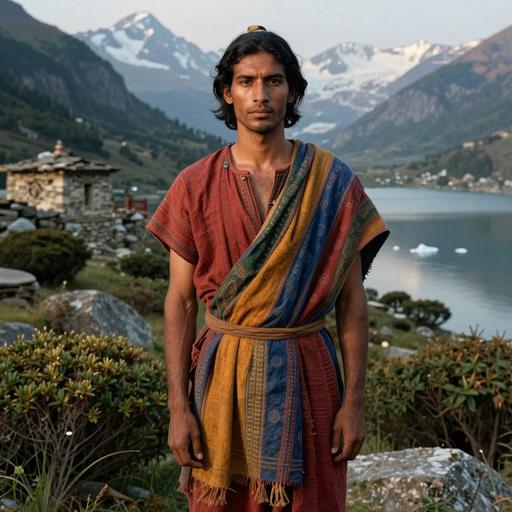
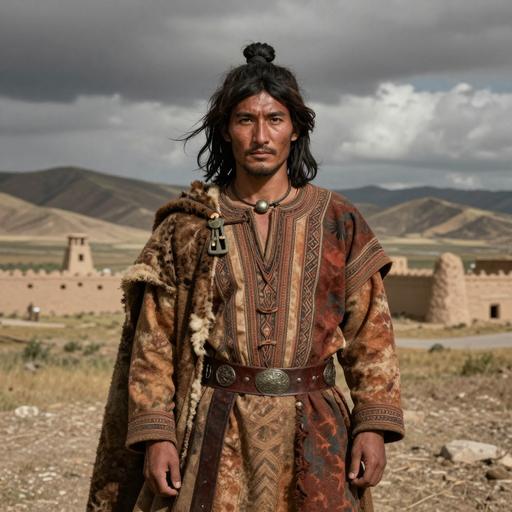
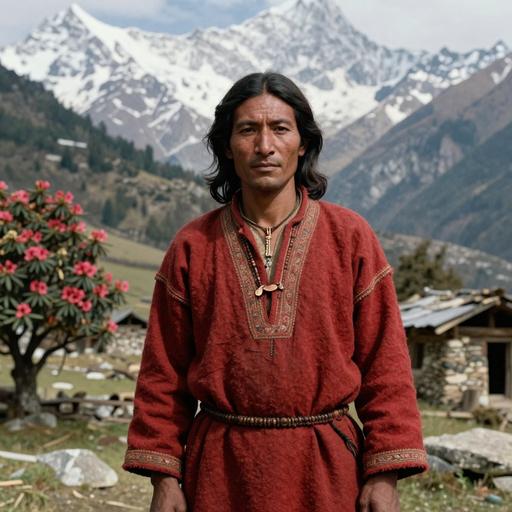
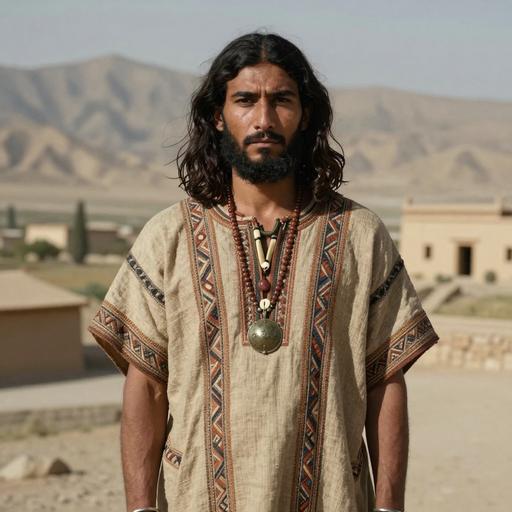
Portraits are AI-generated illustrations. Sample labels and accession IDs identify the reference records.

Portrait Sample Country Era Date Culture mtDNA Match
AI-generated illustrative portrait of Roopkund- A individual, Uttaranchal. Himalaya. Roopkund, India (674-773 CE)
Sample ID: I6943
India India Roopkund A 674-773 calCE (1280±15 BP, PSUAMS-4606) Roopkund Culture M3a1 Subclade
AI-generated illustrative portrait of Xinjiang Jierzankale Jirzankal IA individual, Xinjiang. Kashi Region. Tashikuergan County. Jierzankale, China (733-397 BCE)
Sample ID: C1212
China Iron Age Jierzankale, Xinjiang, China 750-350 BCE Jierzankale Culture M3a1 Subclade
AI-generated illustrative portrait of Roopkund- A individual, Uttaranchal. Himalaya. Roopkund, India (772-950 CE)
Sample ID: I3342
India India Roopkund A 772-950 calCE (1175±20 BP, PSUAMS-5432) Roopkund Culture M3a2 Subclade
AI-generated illustrative portrait of Roopkund- A individual, Uttaranchal. Himalaya. Roopkund, India (772-974 CE)
Sample ID: I3407
India India Roopkund A 772-974 calCE (1160±20 BP, PSUAMS-5437) Roopkund Culture M3a1 Subclade
AI-generated illustrative portrait of IA individual, Swat Valley. Butkara II, Pakistan (819-785 BCE)
Sample ID: I12450
Pakistan Butkara: Iron Age Religious and Cultural Center in Swat Valley, Pakistan 819-785 calBCE (2630±20 BP, PSUAMS-5279) Butkara Culture M3a2 Subclade
AI-generated illustrative portrait of Historic H individual, Swat Valley. Barikot, Pakistan (1,028-1,157 CE)
Sample ID: I6890
Pakistan Historic Barikot 1028-1157 calCE (960±20 BP, PSUAMS-6206) Barikot M3a2 Subclade
AI-generated illustrative portrait of Medieval individual, Swat Valley. Singoor, Pakistan (1,490-1,649 CE)
Sample ID: I1805
Pakistan Medieval Singoor 1490-1649 calCE (310±30 BP, Beta-428668) Singoor M3a1 Subclade
MATERNAL LINEAGE · ANCIENT DNA

Ancient lineage evidence map

Follow parent clades toward this branch and explore where ancient carriers were found.

Loading ancient observations…

Markers are archaeological find locations. A dashed connector is an uncertain, proposed geographic transition between consecutive branches supported by multiple dated observations; it is not an exact travel route, birthplace or proof of direct descent. Parent-clade samples may belong to other descendant branches. Gaps remain where evidence is insufficient. Sample dates differ from haplogroup formation dates.

Reference profile

Carrier Distribution Map

Geographic distribution of 7 ancient DNA samples (direct and subclade carriers of M3A)

Subclade carrier
Time Period Filter
All Time Periods
Showing all samples
Reference profile

Temporal Distribution

Distribution of carriers across archaeological periods

Reference profile

Geographic Distribution

Counts by recorded sample country. These reflect the available reference selection, not population frequencies.

Reference profile

Country × Era Distribution

Compare recorded sample counts across countries and archaeological periods. Select a populated cell to inspect a sample.

Data

Data & Provenance

Source information and data quality

Last Updated 2026-02-16
Confidence Score 50/100
Coverage Low

Data Source

Classification, estimated dates and geographic context reflect the recorded reference data and may change as evidence is revised. Sample coverage is uneven; recorded locations and archaeological associations do not establish personal origin or cultural identity.