mtDNA · Maternal lineage

L1B1A

mtDNA Haplogroup L1B1A

A reference profile for one lineage branch. Shared haplogroups do not establish a family relationship or cultural identity.

Reference profile

Branch background

Historical context for mtDNA lineage branch L1B1A

Origins and Evolution

mtDNA haplogroup L1B1A is a downstream subclade of L1B1, itself a deep-branching West/Central African lineage within macro-haplogroup L. As with other L lineages, L1B1A traces maternal ancestry exclusively along the female line through the mitochondrial genome. Based on the phylogenetic position beneath L1B1 (parent node estimated ~35 kya) and observed diversity in modern populations, L1B1A most likely coalesced in West/Central Africa during the Late Pleistocene to early Holocene (order of ~20 kya, with uncertainty depending on clock calibration and sample coverage). The lineage represents a regional diversification of maternal lineages that contributed to local population structure before and during the Holocene.

Mitochondrial haplogroups are dated using phylogenetic branch lengths and mutation-rate models; because African L lineages are old and diverse, subclades such as L1B1A often show geographically localized structure reflecting long-term continuity combined with episodes of migration and admixture.

Subclades (if applicable)

L1B1A itself can have internal substructure (private mutations defining further subclades) revealed by complete mitogenome sequencing, though many published population surveys rely on control-region or HVS data that under-resolve deep subclades. Where whole-mitogenome data are available, L1B1A splits into geographically informative branches, some concentrated in specific West African ethnic groups and others showing broader distribution consistent with historical movements. Because sampling remains uneven across West and Central Africa, characterization of fine-scale subclades is ongoing; ancient DNA identifications (three samples in the referenced database) provide direct temporal anchors but more ancient genomes would improve subclade dating and phylogeographic reconstruction.

Geographical Distribution

L1B1A is most frequent in West African populations and occurs at variable but detectable frequencies in neighboring Central African groups and in the African diaspora of the Americas. High frequencies are documented in southern West Africa (e.g., Yoruba, Akan, Mende) with moderate presence among Sahelian and some Central African groups (including certain Pygmy populations at low to moderate levels in some surveys). Low-level presence in North Africa and in Afro-descended populations across the Americas reflects historical gene flow and the trans-Atlantic slave trade. The distribution pattern—high in West Africa, present but lower in adjacent regions—fits a model of a regional maternal lineage that diversified locally and was later transported during historical migrations.

Historical and Cultural Significance

Although mtDNA lineages alone cannot reconstruct cultural change, the geographic pattern of L1B1A links it to populations and demographic processes that shaped West African prehistory and history. It likely existed among Late Pleistocene and Holocene hunter-gatherer groups and became part of the maternal gene pool of later farming, pastoralist, and urbanizing communities across West Africa. In the Holocene, climatic changes (Sahara desiccation and Sahel expansions) and the spread of agriculture and later trade networks likely influenced the dispersal and local frequencies of L1B1A. In the historical era, the forced migrations of the trans-Atlantic slave trade carried L1B1A lineages to the Americas, where they persist at low frequencies in African-descended communities, providing a genetic link to West/Central African maternal ancestry.

Conclusion

L1B1A is a regionally important maternal lineage centered on West/Central Africa, reflecting an ancient local diversification within haplogroup L1B1. Its presence in multiple West African ethnic groups and in the African diaspora underscores both deep prehistory and more recent historical movements. Continued mitogenome sequencing and expanded ancient DNA sampling across West and Central Africa will refine the internal structure, age estimates, and migratory history of L1B1A.

Key Points

  • Origins and Evolution
  • Subclades (if applicable)
  • Geographical Distribution
  • Historical and Cultural Significance
  • Conclusion
Reference profile

Tree & Relationships

Phylogenetic context and subclades

Evolution Path

Follow the recorded parent branches toward L1B1A. Dates are estimates and can change as reference data is revised.

Steps Haplogroup Age Estimate Archaeology Era Time Passed Immediate Descendants Tested Modern Descendants Ancient Connections
1 L1B1A Current ~20,000 years ago Mesolithic 20,000 years 3 120 5
2 L1B1 ~35,000 years ago Paleolithic 35,000 years 1 122 0
3 L1B ~55,000 years ago Paleolithic 55,000 years 2 150 0
4 L1 ~150,000 years ago Paleolithic 150,000 years 3 503 4
5 L1'2'3'4'5'6'7 - - - 2 31,852 0
6 L ~160,000 years ago Paleolithic 160,000 years 2 32,236 5
Reference profile

Where in the World

Geographic distribution and modern presence

Recorded origin

West/Central Africa

Modern Distribution

The populations where mtDNA haplogroup L1B1A is found include:

  1. Yoruba (Nigeria, West Africa)
  2. Mende (Sierra Leone, West Africa)
  3. Akan (Ghana / Ivory Coast, West Africa)
  4. Mandinka and other Mande groups (West Africa)
  5. Fulani (West and Central Sahel)
  6. Mbuti and other Central African Pygmy groups (low to moderate frequencies in some surveys)
  7. African-descended populations in the Americas (African American, Afro-Caribbean, Afro-Brazilian) — via the trans-Atlantic slave trade
  8. Sahelian and North African populations (low frequencies consistent with historical admixture)
Historical context

A branch through time

Estimated formation in a broad historical timeline. Period markers provide context and do not imply a connection with particular cultures.

  1. ~20k years ago

    Last Glacial Maximum

    Peak of the last ice age, populations isolated

  2. ~20k years ago

    Haplogroup L1B1A

    Estimated formation of this mtDNA branch; dates and locations are reference estimates.

    This branch
  3. ~10k years ago

    Neolithic Revolution

    Agriculture begins, settled communities form

  4. ~5k years ago

    Bronze Age

    Metalworking, writing, and early civilizations

  5. ~3k years ago

    Iron Age

    Iron tools, expanded trade networks

  6. ~2.5k years ago

    Classical Antiquity

    Greek and Roman civilizations flourish

  7. Present

    Present Day

    Modern era

Reference profile

Archaeological context

Recorded archaeological associations for mtDNA branch L1B1A

Recorded associations

These labels describe archaeological contexts recorded for reference samples linked to L1B1A. An association does not establish that all carriers belonged to a culture or followed a particular migration route.

Afro-Mexican Corded Ware Italy_Sicily_IA_b_IA_c_Punic Italy_Sicily_IA_b_Punic-oAfrica Los Millares Mtwapa Nubian Christian St. Helena Colonial Unetice Culture
Culture assignments are based on archaeological context of ancient DNA samples and may represent regional associations during specific time periods.
Reference profile

Sample Catalog

3 direct carriers and 2 subclade carriers of haplogroup L1B1A

5 shown · 5 matching samples

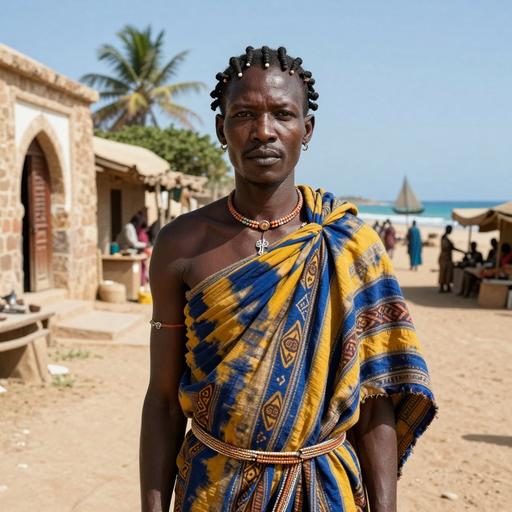
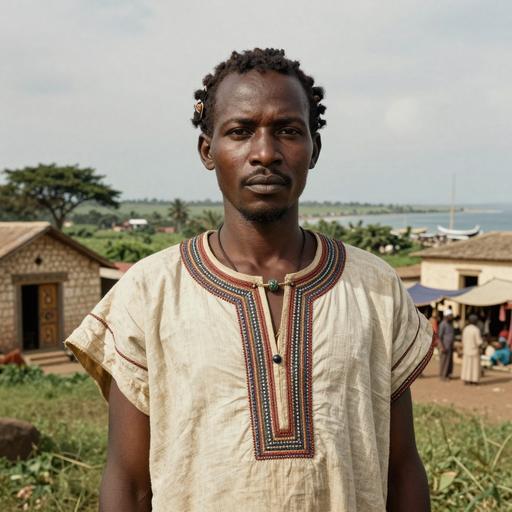
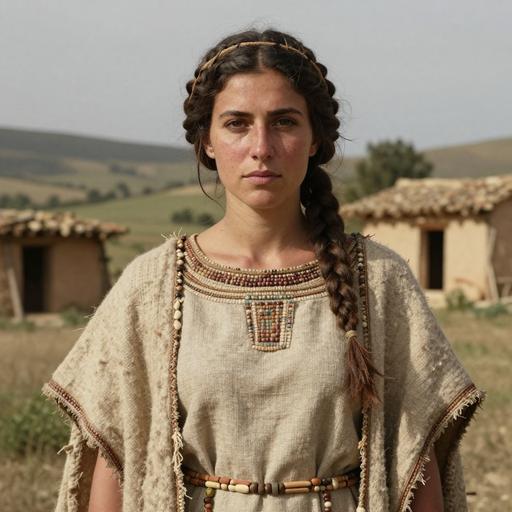
Portraits are AI-generated illustrations. Sample labels and accession IDs identify the reference records.

Portrait Sample Country Era Date Culture mtDNA Match
AI-generated illustrative portrait of Medieval Swahili individual, Mtwapa (Kilifi), Kenya (1,250-1,650 CE)
Sample ID: I24662
Kenya Swahili Culture of Mtwapa 1250-1650 CE Mtwapa L1b1a Direct
AI-generated illustrative portrait of Medieval Swahili individual, Mtwapa (Kilifi), Kenya (1,446-1,623 CE)
Sample ID: I19413
Kenya Swahili Culture of Mtwapa 1446-1623 calCE (430±25 BP, PSUAMS-12669) Mtwapa L1b1a Direct
AI-generated illustrative portrait of Iberian Chalcolithic individual, Madrid. San Fernando de Henares. Camino de las Yeseras, Spain (2,461-2,240 BCE)
Sample ID: I4245
Spain Spain C 2461-2240 calBCE (3875±20 BP, PSUAMS-2320) Los Millares L1b1a Direct
AI-generated illustrative portrait of Nubian Civilization individual, Nubia. Kulubnarti. Cemetery S, Sudan (650-1,050 CE)
Sample ID: I18518
Sudan Early Christian Era in Sudan 650 CE - 1050 CE Nubian Christian L1b1a2 Subclade
AI-generated illustrative portrait of British Empire individual, Rupert’s Valley, St. Helena (1,840-1,940 CE)
Sample ID: STH_499
St. Helena St. Helena 1840 CE - 1940 CE St. Helena Colonial L1b1a10 Subclade
MATERNAL LINEAGE · ANCIENT DNA

Ancient lineage evidence map

Follow parent clades toward this branch and explore where ancient carriers were found.

Loading ancient observations…

Markers are archaeological find locations. A dashed connector is an uncertain, proposed geographic transition between consecutive branches supported by multiple dated observations; it is not an exact travel route, birthplace or proof of direct descent. Parent-clade samples may belong to other descendant branches. Gaps remain where evidence is insufficient. Sample dates differ from haplogroup formation dates.

Reference profile

Carrier Distribution Map

Geographic distribution of 5 ancient DNA samples (direct and subclade carriers of L1B1A)

Direct carrier Subclade carrier
Time Period Filter
All Time Periods
Showing all samples
Reference profile

Temporal Distribution

Distribution of carriers across archaeological periods

Reference profile

Geographic Distribution

Counts by recorded sample country. These reflect the available reference selection, not population frequencies.

Reference profile

Country × Era Distribution

Compare recorded sample counts across countries and archaeological periods. Select a populated cell to inspect a sample.

Data

Data & Provenance

Source information and data quality

Last Updated 2026-02-16
Confidence Score 50/100
Coverage Low

Data Source

Classification, estimated dates and geographic context reflect the recorded reference data and may change as evidence is revised. Sample coverage is uneven; recorded locations and archaeological associations do not establish personal origin or cultural identity.