mtDNA · Maternal lineage

L3H1A2A1

mtDNA Haplogroup L3H1A2A1

A reference profile for one lineage branch. Shared haplogroups do not establish a family relationship or cultural identity.

Reference profile

Branch background

Historical context for mtDNA lineage branch L3H1A2A1

Origins and Evolution

mtDNA haplogroup L3H1A2A1 is a downstream subclade of L3H1A2A, itself nested within the broader African macro-haplogroup L3. Based on the phylogenetic position of L3H1A2A1 beneath L3H1A2A and the coalescence estimates for the parent clade, L3H1A2A1 most likely arose in the Horn/East Africa region in the mid-Holocene (around 5 kya). The haplogroup's limited internal diversity and geographically concentrated occurrences are consistent with a relatively recent origin followed by localized expansion and occasional long-distance dispersal.

Population genetic studies of L3-derived lineages show that many L3 subclades diversified in eastern Africa during the Holocene, often in parallel with cultural shifts such as the spread of pastoralism and Afro-Asiatic language expansions. The presence of L3H1A2A1 in multiple modern and a small number of ancient individuals supports a postglacial, Holocene emergence and continued persistence in eastern Africa.

Subclades

L3H1A2A1 is a terminal subclade under L3H1A2A. As a fine-grained branch it currently shows limited internal branching in published datasets, which indicates either a recent origin or undersampling. Its direct parent clade L3H1A2A is better represented across the Horn and adjacent regions; other sibling or downstream branches of L3H1A2A (where present) vary in geographic distribution but often share an eastern African focus. Continued sampling, especially ancient DNA from Holocene East African contexts, may reveal additional substructure.

Geographical Distribution

The modern distribution of L3H1A2A1 is strongly centered on the Horn of Africa and adjacent eastern African coastal zones. It is reported at low-to-moderate frequencies among Cushitic- and Semitic-speaking groups (e.g., Oromo and Amhara) and in Somali and other Horn populations. Coastal and trading populations on the Swahili coast also show occasional presence, consistent with historic coastal mobility and trade. Low-frequency occurrences further inland and across the continent (Central African hunter-gatherer groups such as some Mbuti samples, small counts in Khoe-San groups and sporadic hits in West African populations like Yoruba) point to past gene flow and complex demographic interactions. Modern diaspora communities in the Americas record very low frequencies attributable to the trans-Atlantic slave trade and subsequent admixture. A handful (five) of ancient DNA hits in curated databases indicate archaeological visibility in Holocene contexts, reinforcing an eastern African Holocene origin with later dispersals.

Historical and Cultural Significance

While L3H1A2A1 is not associated with any single pan-regional cultural phenomenon, its origin and distribution overlap with major Holocene processes in eastern Africa: the rise and spread of pastoralist lifeways (often grouped under the East African "Pastoral Neolithic" horizon), the expansion of Afro-Asiatic-speaking populations, and later coastal trade networks along the Swahili coast. The haplogroup's appearance among both pastoralist-affiliated and hunter-gatherer-associated groups in Central and Southern Africa suggests episodes of admixture and demographic exchange between expanding eastern-African maternal lineages and resident populations.

Because its frequency is low outside eastern Africa, L3H1A2A1 is most informative at regional and local scales for tracing maternal ancestry and movements tied to Holocene eastern African demography rather than as a marker of continent-wide migrations.

Conclusion

mtDNA L3H1A2A1 represents a localized eastern African maternal lineage that likely formed in the Horn/East Africa in the mid-Holocene and subsequently experienced limited dispersal across Africa and into the African diaspora. Its restricted diversity and low-frequency presence outside the Horn are consistent with a scenario of regional emergence followed by episodic gene flow, rather than a wide-scale expansion. Additional sampling—especially ancient DNA from Holocene East African pastoralist and coastal contexts—will refine coalescence estimates and clarify the full geographic and temporal dynamics of this lineage.

Key Points

  • Origins and Evolution
  • Subclades
  • Geographical Distribution
  • Historical and Cultural Significance
  • Conclusion
Reference profile

Tree & Relationships

Phylogenetic context and subclades

Evolution Path

Follow the recorded parent branches toward L3H1A2A1. Dates are estimates and can change as reference data is revised.

Steps Haplogroup Age Estimate Archaeology Era Time Passed Immediate Descendants Tested Modern Descendants Ancient Connections
1 L3H1A2A1 Current ~5,000 years ago Bronze Age 5,000 years 0 1 0
2 L3H1A2A ~5,000 years ago Bronze Age 5,000 years 1 1 5
3 L3H1A2 ~6,000 years ago Chalcolithic 6,500 years 1 1 0
4 L3H1A ~9,000 years ago Neolithic 9,000 years 2 2 3
5 L3H1 ~25,000 years ago Paleolithic 25,000 years 1 6 0
6 L3H ~35,000 years ago Paleolithic 35,000 years 1 6 0
7 L3 ~70,000 years ago Paleolithic 70,000 years 7 30,162 6
8 L3'4 - - - 2 30,212 0
9 L3'4'6 - - - 2 30,216 0
10 L2'3'4'6 - - - 2 31,333 0
11 L2'3'4'5'6'7 - - - 2 31,349 0
12 L1'2'3'4'5'6'7 - - - 2 31,852 0
13 L ~160,000 years ago Paleolithic 160,000 years 2 32,236 5

Subclades (0)

Terminal branch - no recorded subclades

Reference profile

Where in the World

Geographic distribution and modern presence

Recorded origin

Horn / East Africa

Modern Distribution

The populations where mtDNA haplogroup L3H1A2A1 is found include:

  1. Oromo and Amhara (Horn of Africa / East Africa)
  2. Somali and other Horn populations (East Africa)
  3. Coastal East African groups (e.g., Swahili-adjacent populations)
  4. Mbuti and other Central African hunter-gatherer groups (low to moderate frequencies)
  5. Khoe-San groups in Southern Africa (low frequencies)
  6. Yoruba and other West African groups (sporadic/low frequencies)
  7. African-descended populations in the Americas (African American, Afro-Caribbean; low frequencies due to diaspora)
  8. North African and Middle Eastern populations (very low frequencies reflecting historical admixture)
Historical context

A branch through time

Estimated formation in a broad historical timeline. Period markers provide context and do not imply a connection with particular cultures.

  1. ~10k years ago

    Neolithic Revolution

    Agriculture begins, settled communities form

  2. ~5k years ago

    Bronze Age

    Metalworking, writing, and early civilizations

  3. ~5k years ago

    Haplogroup L3H1A2A1

    Estimated formation of this mtDNA branch; dates and locations are reference estimates.

    This branch
  4. ~3k years ago

    Iron Age

    Iron tools, expanded trade networks

  5. ~2.5k years ago

    Classical Antiquity

    Greek and Roman civilizations flourish

  6. Present

    Present Day

    Modern era

Reference profile

Archaeological context

Recorded archaeological associations for mtDNA branch L3H1A2A1

Recorded associations

These labels describe archaeological contexts recorded for reference samples linked to L3H1A2A1. An association does not establish that all carriers belonged to a culture or followed a particular migration route.

Austria_Avar Bungule Corded Ware Elmenteitan Culture Historic Era 2 Iron Age Pastoral Jordanow-Michelsberg Culture Molo Cave Culture Pastoral Neolithic Slab Grave Culture St. Helena Colonial Tanzanian Prehistoric Yemen_Medieval_Soqotri
Culture assignments are based on archaeological context of ancient DNA samples and may represent regional associations during specific time periods.
Reference profile

Sample Catalog

5 direct carriers of haplogroup L3H1A2A1

5 shown · 5 matching samples

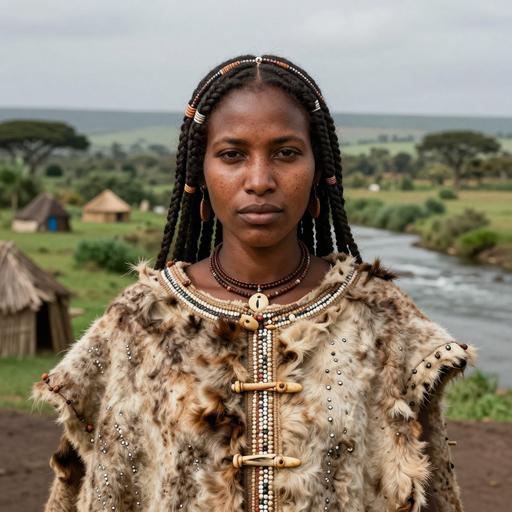
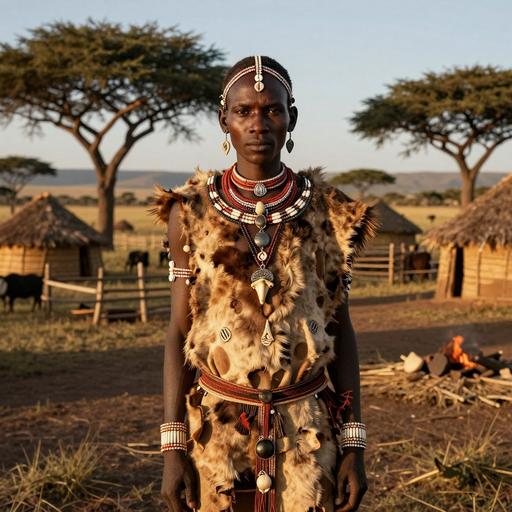
Portraits are AI-generated illustrations. Sample labels and accession IDs identify the reference records.

Portrait Sample Country Era Date Culture mtDNA Match
AI-generated illustrative portrait of African Stone Age individual, Gishimangeda Cave, Tanzania (50-60 BCE)
Sample ID: I13970
Tanzania Prehistoric in Tanzania 50 BCE - 60 BCE Tanzanian Prehistoric L3h1a2a1 Direct
AI-generated illustrative portrait of Pastoral N Elmenteitan individual, Nakuru. Central Rift Valley. Njoro River Cave II, Kenya (91-24 BCE)
Sample ID: I10719
Kenya Kenya PastoralN Elmenteitan 91 calBCE - 24 calCE (2070±15 BP, PSUAMS-4758) Elmenteitan Culture L3h1a2a1 Direct
AI-generated illustrative portrait of Pastoral N individual, Molo Cave. GoJi3, Kenya (437-600 BCE)
Sample ID: MOL001
Kenya Molo Cave Pastoral Neolithic in Kenya 541-637 calCE (1532±21 BP, OxA-37360) Molo Cave Culture L3h1a2a1 Direct
AI-generated illustrative portrait of Nilotic individual, Kasiole 2. GvJh54, Kenya (892-992 BCE)
Sample ID: I12391
Kenya Kenya IA Pastoral 892 BCE - 992 BCE Iron Age Pastoral L3h1a2a1 Direct
AI-generated illustrative portrait of Historic individual, Emurula Ole Polos Cairns. GvJh 122, Kenya (1,527-1,662 CE)
Sample ID: I12379
Kenya Historic Era 2 in Kenya 1639-1797 calCE (270±15 BP, PSUAMS-4938) Historic Era 2 L3h1a2a1 Direct
MATERNAL LINEAGE · ANCIENT DNA

Ancient lineage evidence map

Follow parent clades toward this branch and explore where ancient carriers were found.

Loading ancient observations…

Markers are archaeological find locations. A dashed connector is an uncertain, proposed geographic transition between consecutive branches supported by multiple dated observations; it is not an exact travel route, birthplace or proof of direct descent. Parent-clade samples may belong to other descendant branches. Gaps remain where evidence is insufficient. Sample dates differ from haplogroup formation dates.

Reference profile

Carrier Distribution Map

Geographic distribution of 5 ancient DNA samples (direct and subclade carriers of L3H1A2A1)

Direct carrier
Time Period Filter
All Time Periods
Showing all samples
Reference profile

Temporal Distribution

Distribution of carriers across archaeological periods

Reference profile

Geographic Distribution

Counts by recorded sample country. These reflect the available reference selection, not population frequencies.

Reference profile

Country × Era Distribution

Compare recorded sample counts across countries and archaeological periods. Select a populated cell to inspect a sample.

Data

Data & Provenance

Source information and data quality

Last Updated 2026-02-16
Confidence Score 50/100
Coverage Low

Data Source

Classification, estimated dates and geographic context reflect the recorded reference data and may change as evidence is revised. Sample coverage is uneven; recorded locations and archaeological associations do not establish personal origin or cultural identity.