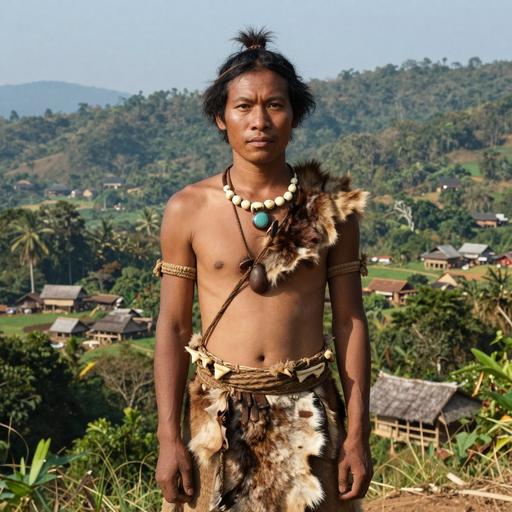
mtDNA · Maternal lineage

M2

mtDNA Haplogroup M2

A reference profile for one lineage branch. Shared haplogroups do not establish a family relationship or cultural identity.

Reference profile

Branch background

Historical context for mtDNA lineage branch M2

Origins and Evolution

mtDNA haplogroup M2 is a primary South Asian branch of macro-haplogroup M, which itself derives from L3. M2 is recognized as one of the deep-rooting maternal lineages in the subcontinent and likely arose in South Asia during the Upper Paleolithic (roughly ~40–60 kya, with many studies placing a central estimate near ~50 kya). The age and internal diversity of M2 indicate an early in situ diversification after the initial post‑Out‑of‑Africa dispersal of L3-derived lineages into South and Southeast Asia.

Subclades (if applicable)

M2 comprises multiple internal branches that have been labelled in phylogenies (commonly as M2a, M2b, and further subbranches depending on the study and resolution). These subclades show geographic structure and variable frequencies across tribal and non-tribal populations of the subcontinent. The presence of several well-differentiated sublineages within M2 is consistent with long-term local evolution and demographic stability punctuated by regional expansions.

Geographical Distribution

M2 is concentrated in South Asia, with the highest frequencies and diversity observed in India (both among tribal/Adivasi groups and many caste groups), Sri Lanka (including indigenous Veddah communities), and to a lesser extent in Pakistan, Bangladesh and Nepal. M2 occurs at varying, generally lower frequencies in Himalayan foothill groups and occasionally in neighboring regions due to historical gene flow. Unlike some M-derived clades that extend broadly into Southeast Asia or Oceania, M2 is predominantly a South Asian maternal lineage with only sporadic occurrences beyond the subcontinent.

Historical and Cultural Significance

Because of its antiquity and distribution, M2 is often interpreted as marking autochthonous South Asian maternal ancestry. It is commonly found among hunter-gatherer and tribal groups (Adivasi), but also among agricultural and caste populations, indicating continuity from Paleolithic and Mesolithic foraging communities into later Neolithic and historical societies. M2 lineages therefore contribute to models of deep population continuity in South Asia and are used in studies contrasting incoming Neolithic/ Bronze Age gene flow with indigenous substrate ancestry.

Conclusion

mtDNA haplogroup M2 represents a long-standing maternal lineage in South Asia, reflecting an early colonization and subsequent regional diversification. Its internal structure and geographical patterns make it a valuable marker for reconstructing Paleolithic and later demographic processes within the subcontinent, including continuity among tribal groups and incorporation into later cultural formations.

Key Points

  • Origins and Evolution
  • Subclades (if applicable)
  • Geographical Distribution
  • Historical and Cultural Significance
  • Conclusion
Reference profile

Tree & Relationships

Phylogenetic context and subclades

Evolution Path

Follow the recorded parent branches toward M2. Dates are estimates and can change as reference data is revised.

Steps Haplogroup Age Estimate Archaeology Era Time Passed Immediate Descendants Tested Modern Descendants Ancient Connections
1 M2 Current ~50,000 years ago Paleolithic 50,000 years 2 22 3
2 M ~60,000 years ago Paleolithic 60,000 years 42 2,671 41
3 L3 ~70,000 years ago Paleolithic 70,000 years 7 30,162 6
4 L3'4 - - - 2 30,212 0
5 L3'4'6 - - - 2 30,216 0
6 L2'3'4'6 - - - 2 31,333 0
7 L2'3'4'5'6'7 - - - 2 31,349 0
8 L1'2'3'4'5'6'7 - - - 2 31,852 0
9 L ~160,000 years ago Paleolithic 160,000 years 2 32,236 5
Reference profile

Where in the World

Geographic distribution and modern presence

Recorded origin

South Asia

Modern Distribution

The populations where mtDNA haplogroup M2 is found include:

  1. Adivasi and tribal groups across India (e.g., Gond, Bhil and other indigenous communities)
  2. Dravidian-speaking populations in South India (Tamil, Telugu regions)
  3. Indo-Aryan speaking populations in North and Central India
  4. Sri Lankan indigenous Veddah and broader Sri Lankan populations
  5. Populations of Pakistan (regional groups with South Asian ancestry)
  6. Bangladesh and Bengali populations at low to moderate frequencies
  7. Nepalese lowland and foothill populations
  8. Himalayan foothill groups with South Asian maternal ancestry
  9. South Asian diaspora communities (e.g., in the Middle East, Europe)
  10. Occasional detections in neighboring South-Central Asian groups
Historical context

A branch through time

Estimated formation in a broad historical timeline. Period markers provide context and do not imply a connection with particular cultures.

  1. ~70k years ago

    Out of Africa

    Major migration of modern humans out of Africa

  2. ~50k years ago

    Upper Paleolithic

    Advanced tool-making, art, and cultural explosion

  3. ~50k years ago

    Haplogroup M2

    Estimated formation of this mtDNA branch; dates and locations are reference estimates.

    This branch
  4. ~20k years ago

    Last Glacial Maximum

    Peak of the last ice age, populations isolated

  5. ~10k years ago

    Neolithic Revolution

    Agriculture begins, settled communities form

  6. ~5k years ago

    Bronze Age

    Metalworking, writing, and early civilizations

  7. ~3k years ago

    Iron Age

    Iron tools, expanded trade networks

  8. ~2.5k years ago

    Classical Antiquity

    Greek and Roman civilizations flourish

  9. Present

    Present Day

    Modern era

Reference profile

Archaeological context

Recorded archaeological associations for mtDNA branch M2

Recorded associations

These labels describe archaeological contexts recorded for reference samples linked to M2. An association does not establish that all carriers belonged to a culture or followed a particular migration route.

Andamanese British Neolithic Goyet Cave Gravettian Katelai Culture Ostuni Culture Spanish Gravettian Udegram Culture Vietnamese Neolithic
Culture assignments are based on archaeological context of ancient DNA samples and may represent regional associations during specific time periods.
Reference profile

Sample Catalog

3 subclade carriers of haplogroup M2 (no direct carriers in the current reference selection)

3 shown · 3 matching samples

Portraits are AI-generated illustrations. Sample labels and accession IDs identify the reference records.

Portrait Sample Country Era Date Culture mtDNA Match
AI-generated illustrative portrait of IA Log Coffin individual, Lahu Pot/Moa Mussur (Mae Hong Son Province), Thailand (240-375 CE)
Sample ID: LHP002
Thailand Iron Age Log Coffin Culture of the Lahu (Mussur) Iron Age 240-375 calCE (1754±23 BP; MAMS-40601) Lahu M23'75 Subclade
AI-generated illustrative portrait of Melanesian individual, Epi Island. Wam Bay, Vanuatu (1,650-1,950 CE)
Sample ID: I4105
Vanuatu Vanuatu 150BP 1650 CE - 1950 CE Vanuatu Colonial M28a-a Subclade
AI-generated illustrative portrait of Vanuatu individual, Epi Island. Wam Bay, Vanuatu (1,650-1,950 CE)
Sample ID: I4105
Vanuatu The First Peoples of Vanuatu 1650 CE - 1950 CE M28a-a Subclade
MATERNAL LINEAGE · ANCIENT DNA

Ancient lineage evidence map

Follow parent clades toward this branch and explore where ancient carriers were found.

Loading ancient observations…

Markers are archaeological find locations. A dashed connector is an uncertain, proposed geographic transition between consecutive branches supported by multiple dated observations; it is not an exact travel route, birthplace or proof of direct descent. Parent-clade samples may belong to other descendant branches. Gaps remain where evidence is insufficient. Sample dates differ from haplogroup formation dates.

Reference profile

Carrier Distribution Map

Geographic distribution of 3 ancient DNA samples (direct and subclade carriers of M2)

Subclade carrier
Time Period Filter
All Time Periods
Showing all samples
Reference profile

Temporal Distribution

Distribution of carriers across archaeological periods

Reference profile

Geographic Distribution

Counts by recorded sample country. These reflect the available reference selection, not population frequencies.

Reference profile

Country × Era Distribution

Compare recorded sample counts across countries and archaeological periods. Select a populated cell to inspect a sample.

Data

Data & Provenance

Source information and data quality

Last Updated 2026-02-16
Confidence Score 50/100
Coverage Low

Data Source

Classification, estimated dates and geographic context reflect the recorded reference data and may change as evidence is revised. Sample coverage is uneven; recorded locations and archaeological associations do not establish personal origin or cultural identity.