Y-DNA · Paternal lineage

I1A1B1A3A

Y-DNA Haplogroup I1A1B1A3A

A reference profile for one lineage branch. Shared haplogroups do not establish a family relationship or cultural identity.

Reference profile

Branch background

Historical context for Y-DNA lineage branch I1A1B1A3A

Origins and Evolution

Y-DNA haplogroup I1A1B1A3A is a downstream branch of I1A1B1A3, itself part of the broader I1 paternal lineage that is strongly associated with northern Europe. Because it is a relatively derived subclade, its most likely formation occurred within Scandinavia or nearby northwestern Europe after the Last Glacial Maximum, when re-expanding hunter-gatherer and later farming populations reoccupied northern latitudes.

The parent lineage I1 is one of the hallmark Y-DNA branches of Europe and is especially frequent in Scandinavia and Germanic-speaking populations. A subclade such as I1A1B1A3A likely represents a localized founder expansion, meaning one or a few male lines rose to prominence within a particular community or regional network and then spread through population growth, mobility, and social continuity.

Subclades

As a downstream lineage, I1A1B1A3A is part of a hierarchical Y-chromosome tree that reflects repeated branching over time. In practical population-genetic terms, this means:

  • It is more geographically and genealogically specific than its parent clade.
  • It may correspond to a small number of ancestral males in the recent prehistoric or early historic past.
  • Its current distribution is likely shaped by drift, founder effects, and regional demographic events rather than by a single large-scale migration alone.

Because this is an intermediate-to-derived clade, published ancient-DNA evidence is often limited at this exact resolution; however, its broader parentage strongly supports a northern European origin with later spread into surrounding regions.

Geographical Distribution

The highest frequencies are expected in Scandinavia, especially in populations with strong continuity from northern and northwestern European paternal ancestry. It is also plausibly present at lower frequencies in Germany, the Netherlands, the British Isles, the Baltic region, East Slavic populations, Central Europe, and the Balkans, reflecting historical mobility and gene flow across Europe.

Outside Europe, this lineage may be observed in diaspora populations in the Americas and Australia, where it would typically reflect recent ancestry from northern or northwestern Europe.

Historical and Cultural Significance

The broader I1 lineage is often discussed in relation to post-glacial recolonization of northern Europe, later Neolithic interactions, and the demographic transformations of the Bronze Age and Iron Age. While no single archaeological culture can be assigned with certainty to I1A1B1A3A specifically, lineages within this paternal branch may have circulated in societies ancestral to or interacting with Corded Ware, Nordic Bronze Age, and later Germanic Iron Age populations.

In a historical context, such a lineage is especially compatible with the paternal ancestry of populations involved in regional northern European continuity, including local chiefdoms, tribal confederations, and later medieval expansions. Its presence today is a reminder that many European Y-DNA clades represent deep regional continuity rather than recent population replacement.

Conclusion

I1A1B1A3A is a derived northern European Y-DNA subclade with strongest expected roots in Scandinavia and nearby northwestern Europe. Its phylogenetic position indicates a relatively localized founder lineage that expanded through subsequent European demographic history, making it an informative marker of fine-scale paternal ancestry within the broader I1 haplogroup.

Key Points

  • Origins and Evolution
  • Subclades
  • Geographical Distribution
  • Historical and Cultural Significance
  • Conclusion
Reference profile

Tree & Relationships

Phylogenetic context and subclades

Evolution Path

Follow the recorded parent branches toward I1A1B1A3A. Dates are estimates and can change as reference data is revised.

Steps Haplogroup Age Estimate Archaeology Era Time Passed Immediate Descendants Tested Modern Descendants Ancient Connections
1 I1A1B1A3A Current ~10,000 years ago Neolithic 10,000 years 0 0 1
2 I1A1B1A3 ~10,000 years ago Neolithic 10,000 years 1 1 0
3 I1A1B1A ~10,000 years ago Neolithic 10,000 years 4 65 6
4 I1A1B1 ~10,000 years ago Neolithic 10,000 years 3 193 0
5 I1A1B ~10,000 years ago Neolithic 10,000 years 1 326 22
6 I1A1 ~10,000 years ago Neolithic 10,000 years 3 410 0
7 I1A ~10,000 years ago Neolithic 10,000 years 5 854 16
8 I1 ~20,000 years ago Mesolithic 20,000 years 3 1,315 2
9 I ~25,000 years ago Paleolithic 25,000 years 4 3,486 79

Subclades (0)

Terminal branch - no recorded subclades

Reference profile

Where in the World

Geographic distribution and modern presence

Recorded origin

Northern Europe

Modern Distribution

The populations where Y-DNA haplogroup I1A1B1A3A is found include:

  1. Scandinavians
  2. Germans, Austrians, and Dutch populations
  3. British and Irish populations
  4. Baltic populations
  5. East Slavic populations
  6. Central European populations
  7. Balkan populations
  8. Recent diaspora populations in the Americas and Australia

Regional Presence

Northern Europe (Scandinavia) High
Western Europe (British Isles) Moderate
Central / Northern Germany and Low Countries Moderate
Baltic (Poland, Latvia, Estonia) Low
North America (diaspora) Low
Eastern Europe Low
Southern Europe Low
Australia and New Zealand Low
Historical context

A branch through time

Estimated formation in a broad historical timeline. Period markers provide context and do not imply a connection with particular cultures.

  1. ~10k years ago

    Neolithic Revolution

    Agriculture begins, settled communities form

  2. ~10k years ago

    Haplogroup I1A1B1A3A

    Estimated formation of this Y-DNA branch; dates and locations are reference estimates.

    This branch
  3. ~5k years ago

    Bronze Age

    Metalworking, writing, and early civilizations

  4. ~3k years ago

    Iron Age

    Iron tools, expanded trade networks

  5. ~2.5k years ago

    Classical Antiquity

    Greek and Roman civilizations flourish

  6. Present

    Present Day

    Modern era

Reference profile

Archaeological context

Recorded archaeological associations for Y-DNA branch I1A1B1A3A

Recorded associations

These labels describe archaeological contexts recorded for reference samples linked to I1A1B1A3A. An association does not establish that all carriers belonged to a culture or followed a particular migration route.

England_Cambridgeshire_Medieval Norse Pre-Viking Swedish Viking Viking Culture Viking Denmark
Culture assignments are based on archaeological context of ancient DNA samples and may represent regional associations during specific time periods.
Reference profile

Sample Catalog

1 direct carrier of haplogroup I1A1B1A3A

1 shown · 1 matching samples

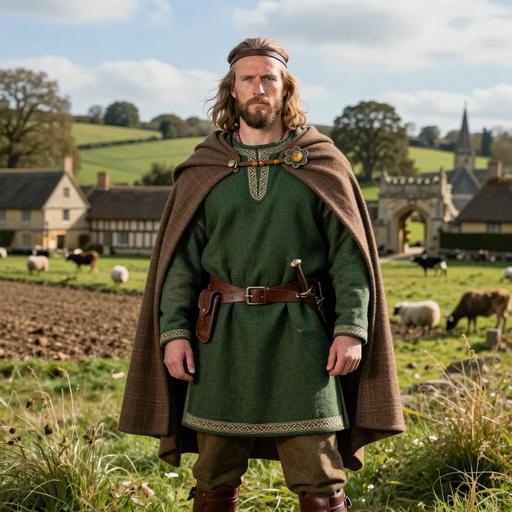
Portraits are AI-generated illustrations. Sample labels and accession IDs identify the reference records.

Portrait Sample Country Era Date Culture Y-DNA Match
AI-generated illustrative portrait of Norse individual, England. Oxford. St John's College Oxford, United Kingdom (880-1,000 CE)
Sample ID: VK165
United Kingdom England Viking 880 CE - 1000 CE Viking I1a1b1a3a~ Direct
PATERNAL LINEAGE · ANCIENT DNA

Ancient lineage evidence map

Follow parent clades toward this branch and explore where ancient carriers were found.

Loading ancient observations…

Markers are archaeological find locations. A dashed connector is an uncertain, proposed geographic transition between consecutive branches supported by multiple dated observations; it is not an exact travel route, birthplace or proof of direct descent. Parent-clade samples may belong to other descendant branches. Gaps remain where evidence is insufficient. Sample dates differ from haplogroup formation dates.

Reference profile

Carrier Distribution Map

Geographic distribution of 1 ancient DNA sample (direct and subclade carriers of I1A1B1A3A)

Direct carrier
Time Period Filter
All Time Periods
Showing all samples
Reference profile

Temporal Distribution

Distribution of carriers across archaeological periods

Reference profile

Geographic Distribution

Counts by recorded sample country. These reflect the available reference selection, not population frequencies.

Reference profile

Country × Era Distribution

Compare recorded sample counts across countries and archaeological periods. Select a populated cell to inspect a sample.

Data

Data & Provenance

Source information and data quality

Last Updated 2026-06-17
Confidence Score 50/100
Coverage Low

Data Source

Classification, estimated dates and geographic context reflect the recorded reference data and may change as evidence is revised. Sample coverage is uneven; recorded locations and archaeological associations do not establish personal origin or cultural identity.