mtDNA · Maternal lineage

N1A1A1A2

mtDNA Haplogroup N1A1A1A2

A reference profile for one lineage branch. Shared haplogroups do not establish a family relationship or cultural identity.

Reference profile

Branch background

Historical context for mtDNA lineage branch N1A1A1A2

Origins and Evolution

mtDNA haplogroup N1A1A1A2 sits within the broader N1a branch, a maternal lineage strongly associated with early farming populations that expanded out of the Near East and Anatolia during the Early Neolithic. Based on its phylogenetic position as a subclade of N1A1A1A, N1A1A1A2 most plausibly arose during the early to mid-Neolithic period (roughly 7–9 kya), contemporaneous with the demographic movements that spread agriculture into Southeastern and Central Europe. The branch is defined by downstream mutations from N1A1A1A and shares the deeper ancestry of N1a, a lineage documented in multiple early Neolithic skeletal assemblages.

Subclades (if applicable)

At present, N1A1A1A2 appears to be a relatively narrow, sparsely sampled subclade. Few well-documented downstream branches are established in the published phylogenies or public databases, and many reported instances come from individual modern or ancient samples that require further sequencing to resolve finer substructure. Because of limited sample sizes, additional subclades may exist but remain uncharacterized until broader mitogenome sequencing of relevant populations is carried out.

Geographical Distribution

Ancient DNA evidence places close relatives of N1A1A1A2 (N1a sublineages) among Early European Farmers (EEF) — notably within Linearbandkeramik (LBK) and other Neolithic farming groups that trace origins to Anatolia and the Levant. In the modern population, N1A1A1A2 is rare: low-frequency occurrences have been reported or inferred in parts of the Balkans, Anatolia, the Caucasus region, and scattered Central European samples. The pattern is consistent with a Neolithic-era dispersal followed by dilution through subsequent migrations (Bronze Age steppe movements, Iron Age and later demographic events) and genetic drift.

Historical and Cultural Significance

Because N1A1A1A2 derives from the N1a lineage, its significance is tied to the early spread of farming cultures in Europe. Lineages of N1a are emblematic in population-genetic studies of the Neolithic transition: they are over-represented in some Early Neolithic burial assemblages (for example LBK sites) and less common in pre-Neolithic hunter-gatherers and later Bronze Age pastoralist groups. Thus, N1A1A1A2 likely reflects maternal ancestry linked to the first farming communities that transformed subsistence and settlement across much of temperate Europe.

Conclusion

N1A1A1A2 is an informative, though currently rare and under-sampled, mtDNA subclade that helps refine the phylogenetic and demographic picture of Neolithic expansions from Anatolia into Europe. Its detection in ancient contexts lends support to a Near Eastern origin and a Neolithic time depth, but fuller understanding of its distribution, internal diversity, and demographic history depends on additional complete mitogenome data from archaeological remains and modern populations in the Near East, Balkans, Caucasus, and Central Europe.

Key Points

  • Origins and Evolution
  • Subclades (if applicable)
  • Geographical Distribution
  • Historical and Cultural Significance
  • Conclusion
Reference profile

Tree & Relationships

Phylogenetic context and subclades

Evolution Path

Follow the recorded parent branches toward N1A1A1A2. Dates are estimates and can change as reference data is revised.

Steps Haplogroup Age Estimate Archaeology Era Time Passed Immediate Descendants Tested Modern Descendants Ancient Connections
1 N1A1A1A2 Current ~8,000 years ago Neolithic 7,500 years 1 16 0
2 N1A1A1AA - - - 1 16 0
3 N1A1A1A ~7,000 years ago Neolithic 7,000 years 3 29 84
4 N1A1A1 ~8,000 years ago Neolithic 8,000 years 2 30 0
5 N1A1AA - - - 1 30 0
6 N1A1A ~9,000 years ago Neolithic 9,000 years 2 56 64
7 N1A1 ~12,000 years ago Neolithic 12,000 years 2 660 0
8 N1A1'2 - - - 2 662 0
9 N1A ~13,000 years ago Mesolithic 13,000 years 2 688 6
10 N1 ~45,000 years ago Paleolithic 45,000 years 3 906 21
11 N1'5 - - - 2 955 0
12 N ~60,000 years ago Paleolithic 60,000 years 16 26,150 13
13 L3 ~70,000 years ago Paleolithic 70,000 years 7 30,162 6
14 L3'4 - - - 2 30,212 0
15 L3'4'6 - - - 2 30,216 0
16 L2'3'4'6 - - - 2 31,333 0
17 L2'3'4'5'6'7 - - - 2 31,349 0
18 L1'2'3'4'5'6'7 - - - 2 31,852 0
19 L ~160,000 years ago Paleolithic 160,000 years 2 32,236 5
Reference profile

Where in the World

Geographic distribution and modern presence

Recorded origin

Near East / Anatolia

Modern Distribution

The populations where mtDNA haplogroup N1A1A1A2 is found include:

  1. Early Neolithic farming communities of Central Europe (e.g., LBK-associated individuals)
  2. Neolithic Anatolian and Near Eastern farming groups
  3. Modern populations in Anatolia / Turkey (low frequency)
  4. Balkan populations (sporadic, low frequency)
  5. Caucasus and adjacent Near Eastern populations (rare reports)
  6. Scattered Central European modern samples (very low frequency)
Historical context

A branch through time

Estimated formation in a broad historical timeline. Period markers provide context and do not imply a connection with particular cultures.

  1. ~10k years ago

    Neolithic Revolution

    Agriculture begins, settled communities form

  2. ~7.5k years ago

    Haplogroup N1A1A1A2

    Estimated formation of this mtDNA branch; dates and locations are reference estimates.

    This branch
  3. ~5k years ago

    Bronze Age

    Metalworking, writing, and early civilizations

  4. ~3k years ago

    Iron Age

    Iron tools, expanded trade networks

  5. ~2.5k years ago

    Classical Antiquity

    Greek and Roman civilizations flourish

  6. Present

    Present Day

    Modern era

Reference profile

Archaeological context

Recorded archaeological associations for mtDNA branch N1A1A1A2

Recorded associations

These labels describe archaeological contexts recorded for reference samples linked to N1A1A1A2. An association does not establish that all carriers belonged to a culture or followed a particular migration route.

Baalberge Culture Bell Beaker Corded Ware Fatyanovo Culture Iron Gates Culture Lasinja Culture Linear Pottery Culture Popova Culture Sweden_N
Culture assignments are based on archaeological context of ancient DNA samples and may represent regional associations during specific time periods.
Reference profile

Sample Catalog

25 direct carriers and 4 subclade carriers of haplogroup N1A1A1A2

10 shown · 29 matching samples

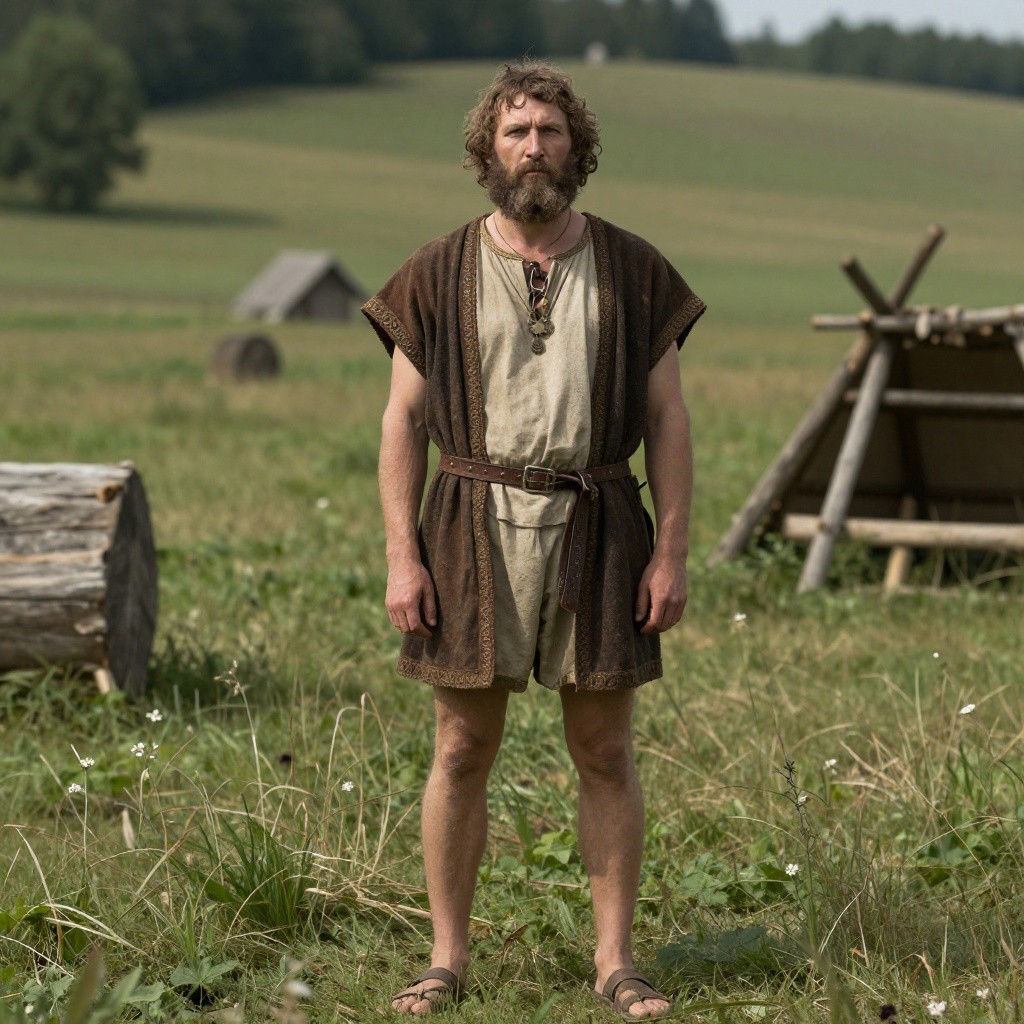
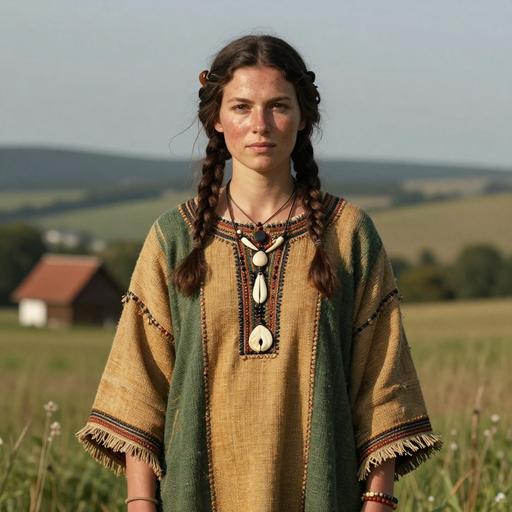
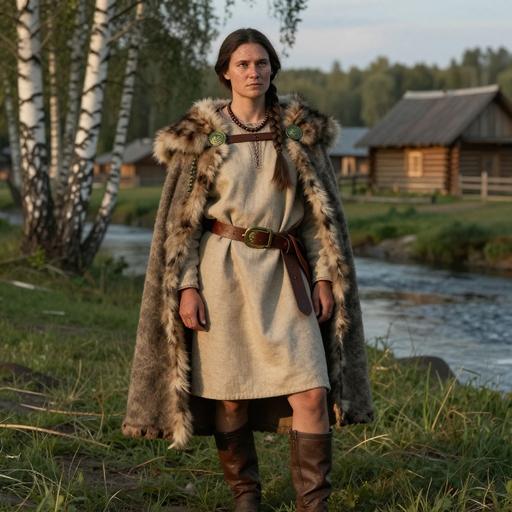
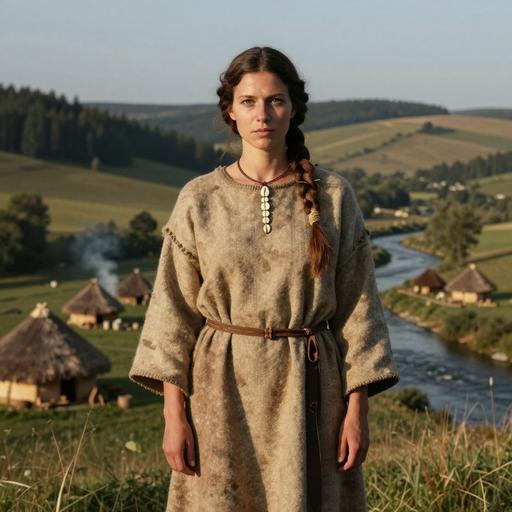
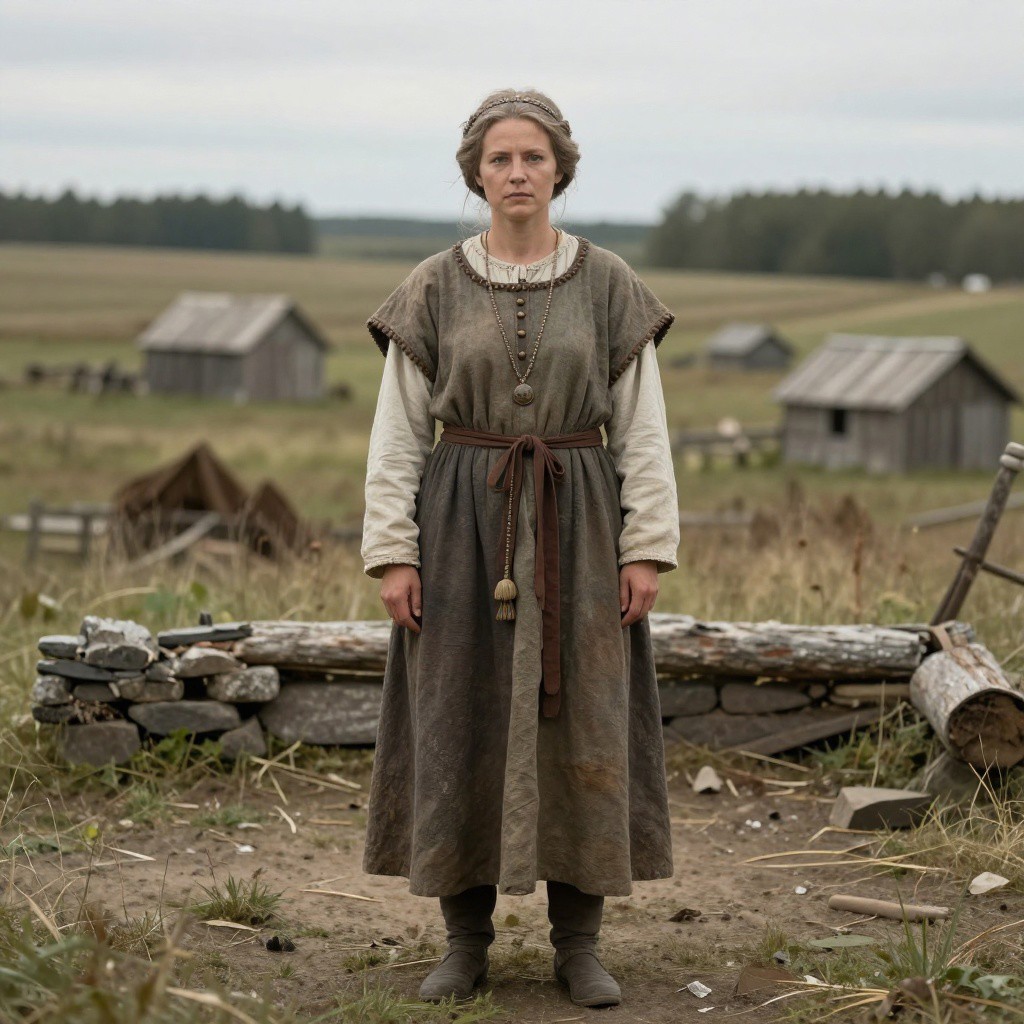
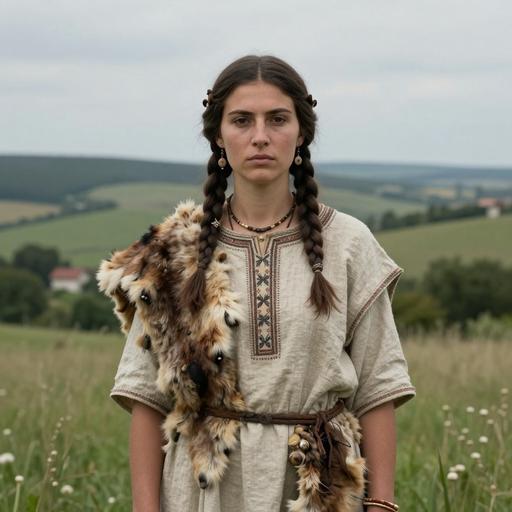
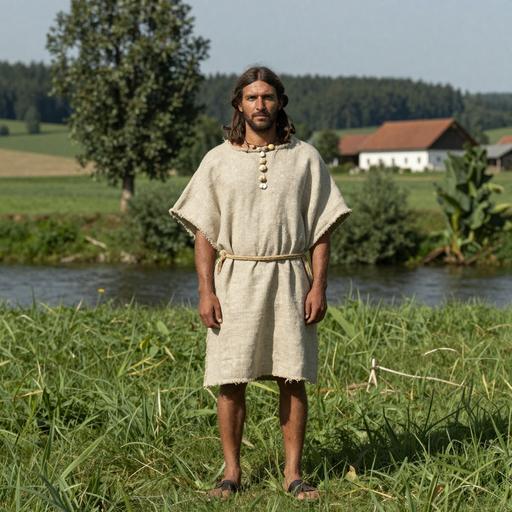
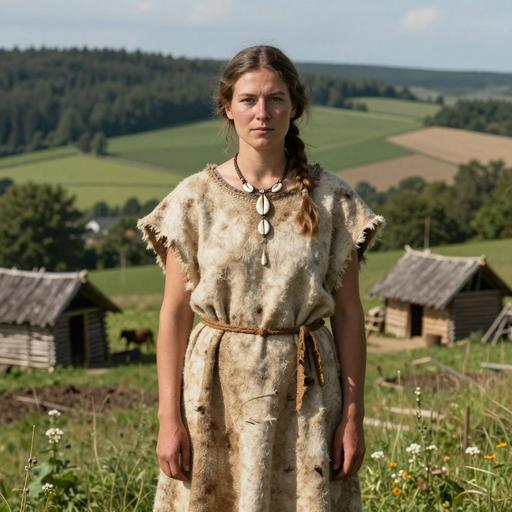
Portraits are AI-generated illustrations. Sample labels and accession IDs identify the reference records.

Portrait Sample Country Era Date Culture mtDNA Match
AI-generated illustrative portrait of IA Wielbark individual, Masłomęcz (Lublin Province, Hrubieszów County, Hrubieszów), Poland (200-400 CE)
Sample ID: PCA0111
Poland Wielbark Culture 200-400 CE Wielbark N1a1a1a2 Direct
AI-generated illustrative portrait of England EIA individual, England. Wiltshire. Rowbarrow, United Kingdom (460-382 BCE)
Sample ID: I19863
United Kingdom England EIA 460-382 calBCE (2342±21 BP) [R_combine: (2359±29 BP, SUERC-41690), (2327±28 BP, SUERC-47739)] Early British Iron Age N1a1a1a2 Direct
AI-generated illustrative portrait of Avar individual, Mödling-An der Goldenen Stiege (Lower Austria, Mödling District), Austria (639-811 CE)
Sample ID: MGS262
Austria Austria Avar 650-800 CE Austria_Avar N1a1a1a2 Direct
AI-generated illustrative portrait of Avar individual, Mödling-An der Goldenen Stiege (Lower Austria, Mödling District), Austria (639-811 CE)
Sample ID: MGS273
Austria Austria Avar 650-800 CE Austria_Avar N1a1a1a2 Direct
AI-generated illustrative portrait of Norse individual, England. Dorset. Ridgeway Hill Mass Grave, United Kingdom (970-1,025 CE)
Sample ID: VK264
United Kingdom England Viking 970 CE - 1025 CE Viking N1a1a1a2 Direct
AI-generated illustrative portrait of Viking individual, England. Dorset. Ridgeway Hill Mass Grave, United Kingdom (970-1,025 CE)
Sample ID: VK264
United Kingdom The Viking Age 970 CE - 1025 CE N1a1a1a2 Direct
AI-generated illustrative portrait of Nordic Bronze Age individual, Karlstrup, Denmark (1,426-1,272 BCE)
Sample ID: RISE21
Denmark Denmark BA 1426 BCE - 1272 BCE Nordic Bronze Age N1a1a1a2 Direct
AI-generated illustrative portrait of Nordic Ba individual, Karlstrup, Denmark (1,426-1,272 BCE)
Sample ID: RISE21
Denmark Bronze Age Nordic Countries 1426 BCE - 1272 BCE N1a1a1a2 Direct
AI-generated illustrative portrait of BA individual, Siniarzewo-1 (Kuyavian-Pomeranian Province, Aleksandrów County, Zakrzewo), Poland (1,950-1,726 BCE)
Sample ID: poz929
Poland Bronze Age Poland 1941-1746 calBCE (3520±35, Poz-92318) Polish Bronze Age N1a1a1a2 Direct
AI-generated illustrative portrait of Czechia EBA Unetice individual, Bohemia. Praha-Miškovice, Czech Republic (2,192-1,947 BCE)
Sample ID: PMI003
Czech Republic Early Bronze Age Unetice Culture, Bohemia, Czech Republic 2192-1947 calBCE (3670±35 BP, UtC-13189) Unetice Culture N1a1a1a2 Direct
MATERNAL LINEAGE · ANCIENT DNA

Ancient lineage evidence map

Follow parent clades toward this branch and explore where ancient carriers were found.

Loading ancient observations…

Markers are archaeological find locations. A dashed connector is an uncertain, proposed geographic transition between consecutive branches supported by multiple dated observations; it is not an exact travel route, birthplace or proof of direct descent. Parent-clade samples may belong to other descendant branches. Gaps remain where evidence is insufficient. Sample dates differ from haplogroup formation dates.

Reference profile

Carrier Distribution Map

Geographic distribution of 29 ancient DNA samples (direct and subclade carriers of N1A1A1A2)

Direct carrier Subclade carrier
Time Period Filter
All Time Periods
Showing all samples
Reference profile

Temporal Distribution

Distribution of carriers across archaeological periods

Reference profile

Geographic Distribution

Counts by recorded sample country. These reflect the available reference selection, not population frequencies.

Reference profile

Country × Era Distribution

Compare recorded sample counts across countries and archaeological periods. Select a populated cell to inspect a sample.

Data

Data & Provenance

Source information and data quality

Last Updated 2026-06-14
Confidence Score 50/100
Coverage Low

Data Source

Classification, estimated dates and geographic context reflect the recorded reference data and may change as evidence is revised. Sample coverage is uneven; recorded locations and archaeological associations do not establish personal origin or cultural identity.