A man buried in Belgium in the era

Download PDF creates a visual, rasterized copy. Use Print for selectable text and better assistive-technology support.

Loading Report

Preparing your ancestry journey

Preparing the available report content...

Your report will open automatically.

Skip to main content
Reference library / Sample profile

A man buried in Belgium in the era

Explore the recorded context, genetic comparisons and research behind this reference sample.

BelgiumBelgium Roman

A reference profile describes this sample. It does not establish a personal or family relationship.

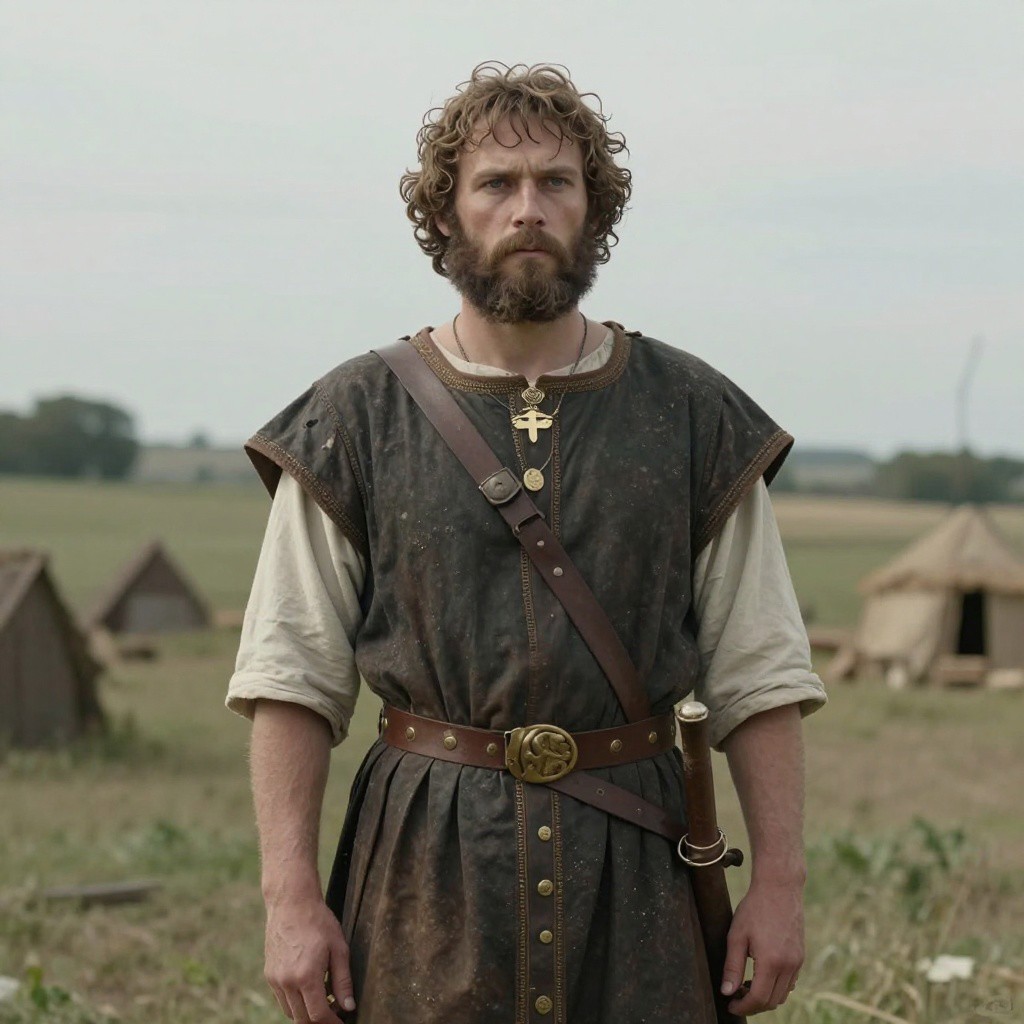
AI portrait reconstruction for A man buried in Belgium in the  era
AI-generated artistic reconstruction, not a photograph of the individual.
Record

Sample details

Recorded details and available lineage markers.

Individual

Roman individual, Belgium

Sample ID: I21059

Date Range

3 BCE - 53 CE

Cultural Period

Belgium Roman

Biological Sex

Male

mtDNA Haplogroup

H7

Y-DNA Haplogroup

R-L151

Geography

Location

Where this individual was discovered

Country Belgium
Locality Tongeren-Beukenbergweg (Vlaams Gewest, Limburg)
Coordinates 50.7799, 5.4384
Chronology

Date range

When this individual lived in the broader context of human history

Roman individual, Belgium 3 BCE - 53 CE
Context

Historical context

Background information associated with the reference record.

Roman-period Belgium occupied a strategic position within the northwestern European landscape, connecting coastal zones, river routes, and inland settlements. Environments included cultivated plains, river valleys, and areas of forest and pasture that supported agriculture and stock-raising, enabling both local consumption and supply to garrisons and towns.

Historical Context

From the early imperial period into Late Antiquity, Roman authority expanded and then consolidated across parts of the region. “Belgium Roman” aligns with the broader Roman presence in the Low Countries, when imperial governance and military logistics shaped settlement patterns and regional connectivity.

Populations & Lifeways

Local populations persisted, living in villages and smaller settlements while increasingly interacting with Roman towns, roads, and marketplaces. Many households would have continued agricultural work—grain production, animal husbandry, and related crafts—supplemented by wage labor or specialized services tied to Roman economic life.

Archaeology & Material Culture

Archaeological evidence typically reflects Roman infrastructure and consumption: ceramic and glass vessels, coin circulation, and building debris associated with domestic and civic activity. Finds related to travel and communication—such as imported goods and items indicating craft specialization—support interpretations of integration into imperial trade networks. Field systems, settlement layouts, and cemetery patterns can also show changes in practice under Roman influence.

Culture & Society

Romanization was not uniform; instead, it is visible in a spectrum of local choices. Some communities adopted Roman-style building, artifacts, and public behavior, while others retained regional traditions. Social life would have included participation in market exchange, craft production, and the cultural practices associated with towns, alongside continued local identities.

Legacy & Transition

Roman administration and infrastructure influenced later developments even as imperial control weakened in the late 4th–5th centuries CE. After the end of the Western Empire, settlement and economic patterns changed, but the archaeological record preserves the long-term impact of Roman roads, urban forms, and material lifeways.

Analysis

Genetic comparisons

These comparisons show genetic similarity, not identity or origin. The populations listed are those whose genomes show statistical alignment to this ancient individual.

Similarity reflects shared history, not shared identity. These are analytical comparisons, not claims about who this person was.

Modern Genetic Admixture

This analysis compares the DNA profile with present-day reference populations, showing statistical similarity to modern reference populations from different regions. The excavation site records where this individual was found, not a fixed modern genetic identity.
Europe 95.6%
Northwestern European 58.5%
English 45.2%
Northwestern European 6.8%
Scandinavian 6.6%
Southern European 25.7%
Iberian 20.3%
Italian 4.8%
Sardinian 0.6%
Eastern European 11.3%
Asia 4.4%
Northern West Asian 4.4%
Caucasian 3.3%
Cypriot 1.2%

Closest Modern Populations

These are the modern populations showing the closest statistical alignment to A man buried in Belgium in the era, ranked by genetic distance. Lower distance values indicate closer statistical similarity. Cross-region similarity can reflect shared ancestry, population movement, continuity, or later admixture.

1
Afrikaner
3.1020
2
Orcadian
3.3632
3
Scottish
3.4779
4
Belgiana
3.5584
5
Dutch
3.5843
6
English
3.6361
7
French Brittany
3.7137
8
Irish
3.7666
9
Welsh
3.8128
10
German
3.8496
Context

Related Samples

This individual exists within a broader network of ancient samples. No ancient genome stands alone.

Individual Culture/Period Date Location Action
N individual, Belgium 3066 BCE Pommeroeul (Wallonne Gewest, Henegouwen), Belgium View
N individual, Belgium 2956 BCE Pommeroeul (Wallonne Gewest, Henegouwen), Belgium View
Roman individual, Belgium 3 BCE Tongeren-Beukenbergweg (Vlaams Gewest, Limburg), Belgium View
N individual, Belgium 3035 BCE Pommeroeul (Wallonne Gewest, Henegouwen), Belgium View
Page 1
Individual Culture/Period Date Location Action
Roman individual, Belgium 3 BCE Tongeren-Beukenbergweg (Vlaams Gewest, Limburg), Belgium View
Page 1
Sources

References

Scientific publications and genetic data that inform this profile.

G25 Coordinates

These coordinates represent a position in genetic space, a tool for comparison, not a conclusion. You can use these to perform custom admixture analysis in G25 Studio.

I21059,0.1211548,0.11553134,0.05387098,0.03915114,0.02955138,0.01221966,0.0038898,0.00219756,0.00343048,8.718E-05,-0.00518968,0.00704112,-0.0106526,-0.0107517,0.01627394,-0.00969654,-0.0188065,-0.00119292,-0.00169154,-0.00439982,0.00549614,0.00269906,-0.0097398,0.0064836,-0.00412073
Continue in G25 Studio
Use code for 30% off • Expires Nov 16