Introduction
If you have ever run a DNA ancestry analysis and found that your results swing between Celtic and Germanic depending on the calculator, you are not alone. This is one of the most common frustrations in Northwestern European ancestry research, especially when using tools like G25 coordinates or admixture calculators.
The reason is not that the tools are broken. It is that many populations labeled Celtic or Germanic share a deep genetic background, so their modern DNA profiles overlap heavily. That overlap matters for anyone trying to understand ancestry, migration, population genetics, and how ancient DNA is used to interpret modern results.
Key Discoveries / Main Points
- Shared Bell Beaker ancestry: Both Celtic-related and Germanic-related populations descend in large part from the same Bronze Age genetic substrate across Northwestern Europe.
- Limited autosomal separation: On genome-wide DNA data, the differences between many Celtic and Germanic reference groups are subtle, which makes them hard to distinguish statistically.
- G25 has real limits: G25 is excellent for broad ancestry contrasts, but it struggles when two source populations are extremely close in genetic space.
- qpAdm is more rigorous, but not magical: qpAdm uses formal statistics and outgroups, yet it still depends on whether the underlying populations are genetically distinguishable.
- Y-DNA haplogroups can help: Paternal lineages such as R1b-P312, R1b-U106, R1b-L21, and I1 often provide finer clues than autosomal DNA alone.
- Rare variants and IBD may improve resolution: Future methods using rare alleles and identity-by-descent (IBD) could help distinguish very closely related regional histories.
What This Means for Your DNA
For most people exploring their ancestry, the most important takeaway is simple: a label like Celtic or Germanic is usually a statistical shorthand, not a precise identity tag. If your DNA can be modeled in more than one way, that often means the reference populations are close relatives in genetic history, not that your results are wrong.
This is especially true for people with roots in Ireland, Britain, the Netherlands, northern France, Denmark, western Germany, or adjacent regions. These populations have exchanged ancestry for thousands of years, and their DNA reflects both ancient continuity and later regional drift. In practical terms, your results may point to a broad Northwestern European profile with small shifts toward one side or the other, depending on the calculator and the references used.
For genealogy and family history, that means caution is essential. A calculator that leans more “Celtic” does not prove Celtic identity, just as a model that leans more “Germanic” does not prove Germanic origin. The best interpretation is usually broader and more honest: your ancestry likely comes from a shared European genetic landscape shaped by Bronze Age migrations, later tribal formations, and long-term regional mixing.
Historical and Archaeological Context
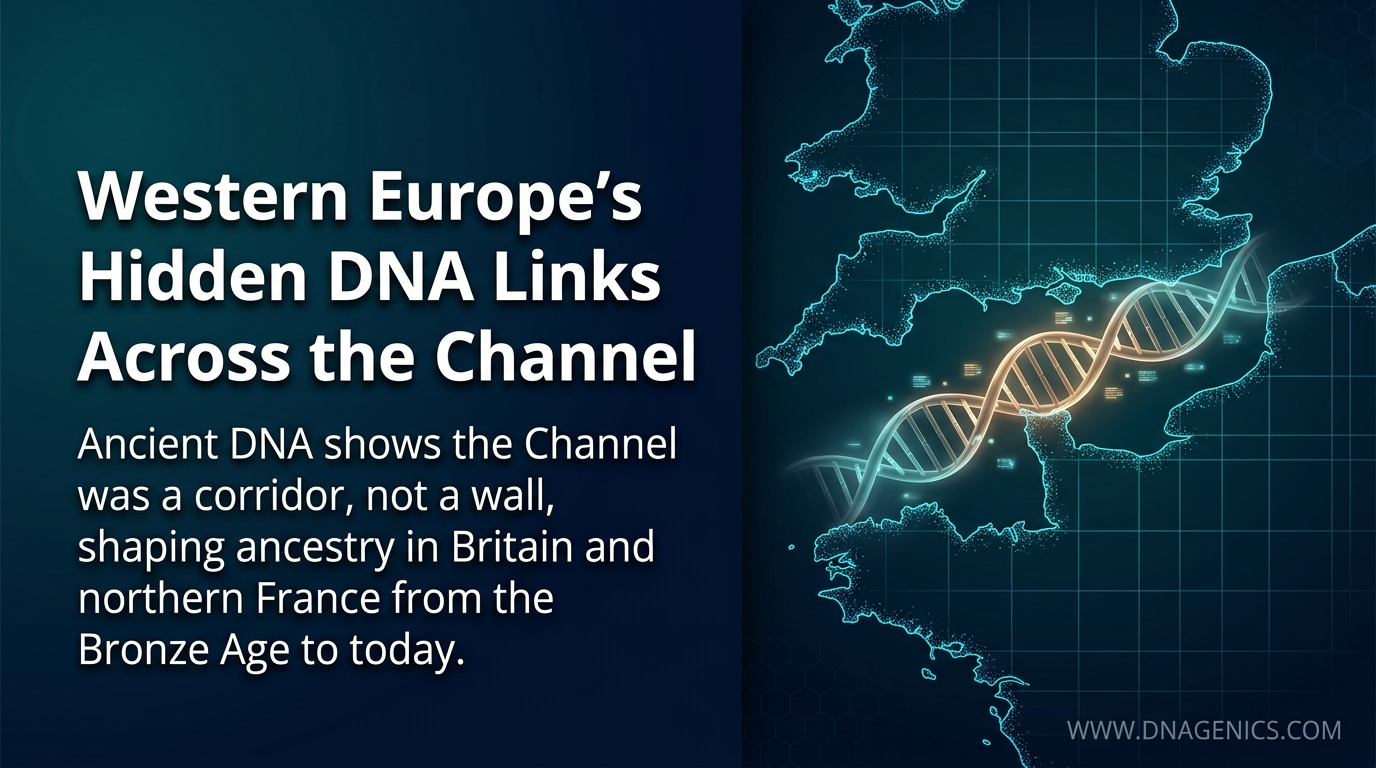
To understand why these DNA patterns are so similar, you have to go back to the Bronze Age. A major transformation across Northwestern Europe came with the spread of Bell Beaker-associated populations between roughly 2800 and 2000 BCE. These groups carried a mix of Western Hunter-Gatherer (WHG), Early European Farmer (EEF), and Steppe ancestry, and they reshaped the genetic landscape of Britain and much of continental Europe.
Ancient DNA studies show that Britain experienced a massive genetic turnover during this period, with the incoming Bronze Age population replacing most of the earlier gene pool. From this shared Bell Beaker base, later Iron Age populations that archaeologists and historians associate with Celtic-speaking and Germanic-speaking worlds developed in parallel. That includes groups linked to the Hallstatt and La Tène spheres, Atlantic populations in Britain and Armorica, and communities around the North Sea and western Baltic.
The important point is that language and culture changed faster than the underlying autosomal DNA. In other words, the Celtic and Germanic distinctions that matter in history and archaeology are real, but they do not map cleanly onto a simple genetic divide. The populations were neighbors, cousins, and sometimes long-term contributors to one another, which is why modern DNA often shows a continuum rather than a sharp border.
The Science Behind It
Tools like G25 reduce genome-wide SNP data into a compact set of principal components. That is powerful because it captures the biggest patterns in human variation, but it also means subtle differences can get compressed or blurred. When two populations are already close together, as many Celtic and Germanic Iron Age groups are, small measurement changes can make model outputs swing noticeably.
This is why admixture calculators sometimes produce unstable ratios. If two reference groups sit very near each other in genetic space, the model can fit your sample in several nearly equivalent ways. The math does not always choose one biologically meaningful answer, it chooses one of many nearly tied statistical solutions. qpAdm is more formal because it tests whether a mixture model is statistically acceptable using allele-sharing patterns, but it still faces the same basic problem when the source populations are only weakly differentiated.
In Simple Terms: If two ancestry reference groups are almost genetically alike, a calculator may not be able to tell which one contributed more to your DNA. The result is not a mistake, it is a sign that the populations are too similar for the method to separate cleanly.
At the deeper technical level, the issue is one of resolution. Autosomal DNA reflects thousands of generations of recombination and mixing, so closely related populations often overlap in a way that only the finest statistical tools can detect. That is why paternal markers and high-resolution ancient samples can sometimes reveal patterns that whole-genome ancestry calculators cannot.
Why It Matters
This topic matters because it highlights the difference between broad ancestry inference and fine-scale historical reconstruction. Many people want a clean answer, but population genetics often gives probabilities, not certainties. Understanding the limits of ancestry tools helps prevent overinterpretation and makes results more trustworthy.
It also points to where the field is heading. Better resolution may come from rare allele analysis, IBD sharing, larger ancient DNA datasets, and more carefully chosen regional reference panels. For now, the best approach is to combine autosomal DNA with haplogroups, historical context, and realistic expectations about what ancestry tools can and cannot resolve.
References / Further Reading
- Ancient DNA research on Bronze Age Britain and Bell Beaker population turnover
- Background on ADMIXTOOLS and qpAdm in population genetics
- General literature on Bell Beaker, Steppe ancestry, and Northwestern European ancient DNA
- Y-DNA resources on R1b-P312, R1b-U106, R1b-L21, and I1 haplogroups