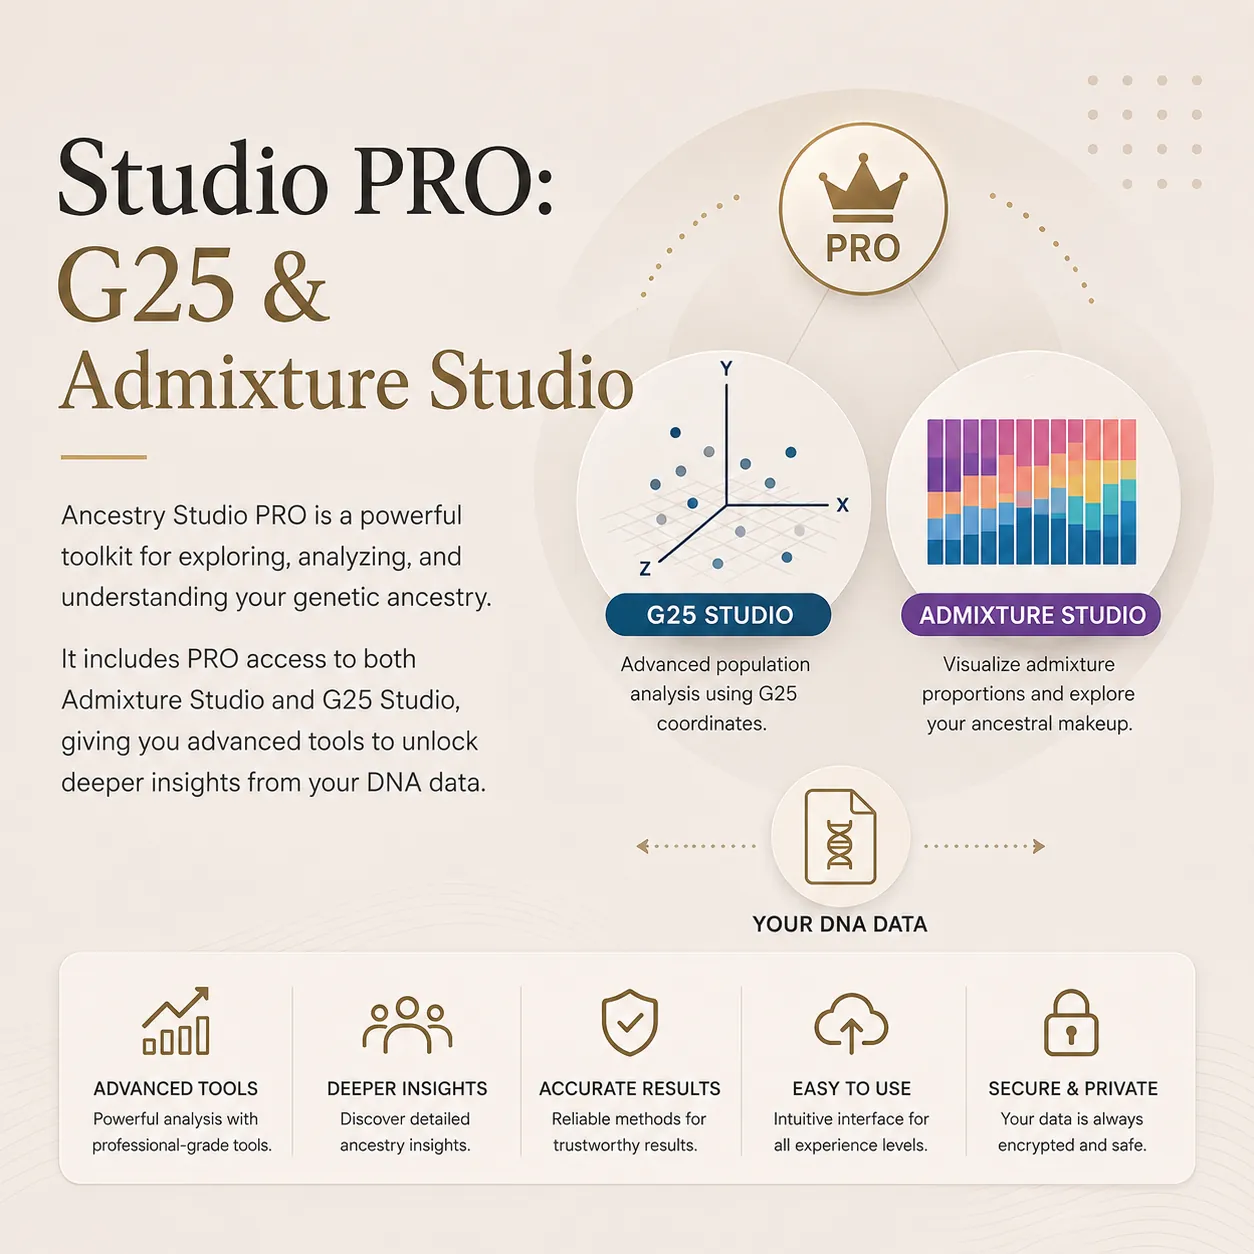
Advanced Analysis Tools
Five specialized instruments for researchers who need more than standard distance comparisons. Constrained fitting, genetic gradients, clustering heatmaps, principal component projections, and phylogenetic tree construction.
G25 Studio's standard tools compare your coordinates against reference populations using distance metrics and Monte Carlo modeling. The advanced toolkit goes further: it lets you constrain models, visualize structure, build gradients, and construct hierarchical relationships.
Find optimal population mixtures with constrained proportions
The Fit Modeler lets you define your own source populations and optionally lock specific proportions before running the optimization. This hypothesis-driven approach means you can test specific ancestral scenarios rather than relying solely on unconstrained algorithms.
Lock one population at 40% and let the algorithm find the best combination for the remaining 60%. Compare constrained results against unconstrained ones to understand how forced assumptions affect model quality. The residual distance tells you how well each configuration explains your coordinates.
Genetic gradient interpolation between any two populations
A genetic cline is a gradient of genetic change between two reference populations. The Cline Builder creates a continuous spectrum of interpolated coordinates between any two populations you choose, then measures where your DNA falls on that gradient.
This reveals whether you sit closer to one endpoint, fall in the middle, or even lie outside the gradient entirely. Use it to test migration corridors, hybrid zone models, or simply to understand your genetic position relative to two reference groups.
Visualize genetic distances with color-coded matrices and hierarchical ordering
The Heatmap tool computes pairwise genetic distances between all selected populations and your coordinates, then renders them as a color-coded matrix. Cool colors represent high similarity; warm colors indicate greater genetic distance. The result is an intuitive visual overview of population relationships.
Hierarchical clustering automatically reorders the matrix rows and columns so that genetically similar populations appear adjacent. The accompanying dendrogram on the side reveals the branching structure of population similarities, making patterns immediately apparent that raw distance tables cannot convey.
Visualize genetic positions with Principal Component Analysis
Principal Component Analysis reduces the 25 dimensions of G25 data into two principal axes that capture the largest variance in the dataset. The result is a 2D scatter plot where each point represents a population or individual, and proximity reflects genetic similarity.
Your position on the PCA plot reveals which population clusters you sit closest to, whether you fall between clusters (suggesting admixed ancestry), or whether you occupy a unique position. The interactive plot lets you zoom, pan, and identify individual points for detailed exploration.
Build hierarchical clustering trees from genetic coordinates
The Phylogenetic Tree Builder constructs dendrograms from pairwise genetic distances between your sample and selected reference populations. The resulting tree shows which populations cluster together and, critically, where your genetic profile branches relative to those clusters.
Branch lengths reflect the degree of genetic difference: short branches between two nodes mean high similarity, while long branches indicate greater divergence. This hierarchical view reveals population relationships that flat distance tables and scatter plots cannot easily convey.
Each tool answers a different question about your genetic data. Use them together for a comprehensive view of your position in the genetic landscape.
All five advanced tools are included with G25 Studio Pro. One-time payment, lifetime access.
Plus all other Pro features: advanced algorithms, K-Means clustering, Pearson correlation, Ancestry Timeline, and more.
The advanced tools transform G25 Studio from a comparison engine into a full research environment. Start exploring now.