Menu
Currency
Ancestry
Skip to report catalog

DNA report catalog

Find the ancestry comparison that answers your question

Start with historical population reports, then explore population matching, lineage branches, advanced models, and archaic genome comparisons. Results describe statistical genetic similarity to reference data and are not proof of a personal family tree.

  • Historical and contemporary panels
  • Multiple comparison methods
  • Clear interpretation context

02 · Compare populations

Population Matching & Origins

Compare your genetic profile with historical, contemporary, and ancient reference datasets.

Historical population map illustrating genetic similarity comparisons Available

Historical Population Origins

Compare shared DNA patterns with historical reference populations and view population-level similarity across regions.

  • Historical reference populations
  • Regional similarity estimates
  • Migration and cultural context

View report details
World population map illustrating contemporary genetic similarity estimates Available

Contemporary Population Origins

Explore genetic similarity to contemporary reference populations and see how comparison estimates vary by region.

  • 200+ reference populations
  • Percentage-based estimates
  • Interactive geographic views
View report details
Ancient archaeological individuals illustrating chromosomal segment matching Available

Shared Roots Matches

Compare chromosomal segments with ancient individuals from archaeological datasets and inspect match context by sample.

  • 9,000+ ancient samples
  • Chromosomal segment matching
  • Archaeological sample context
View report details
Ancient individuals illustrating global reference population composition Available

Ancient Global Composition

Model your genetic profile against ancient reference panels spanning world regions and thousands of years.

  • Global ancient reference panels
  • Composite-profile estimates
  • Interactive sample map
View report details
Global map illustrating the HGDP K72 population reference model Available

HGDP K72 Global Report

Analyze population structure with a 72-component model based on Human Genome Diversity Project reference data.

  • 72 population components
  • Global diversity reference panel
  • Population-structure visualizations
View report details

03 · Explore lineage branches

Haplogroup Analysis

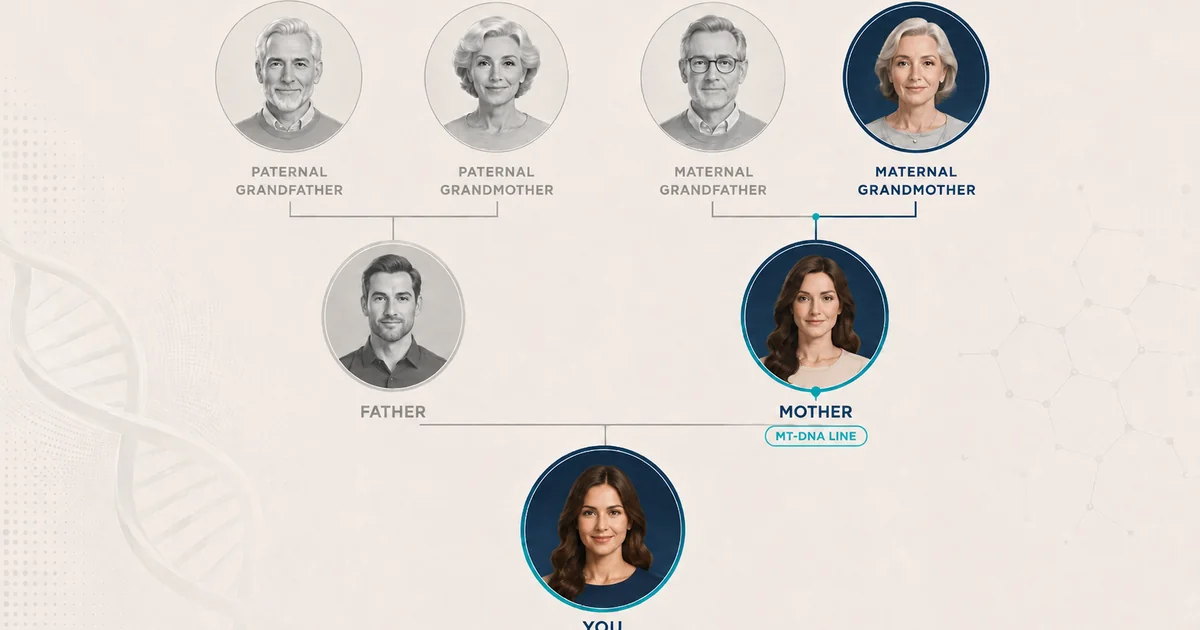
Estimate maternal and paternal lineage branches from mtDNA and available Y-DNA markers.

Mitochondrial DNA branch diagram illustrating maternal haplogroup analysis Available

Maternal Haplogroup (mtDNA)

Estimate your mitochondrial haplogroup branch and explore its placement, age ranges, and migration context.

  • mtDNA branch estimate
  • Subclade placement
  • Migration and age context
View report details
Y chromosome branch diagram illustrating paternal haplogroup analysis Available

Paternal Haplogroup (Y-DNA)

Estimate your Y-DNA haplogroup branch and explore its placement, subclades, and migration context where Y data is available.

  • Y-DNA branch estimate
  • Subclade placement
  • Migration and age context
View report details

04 · Go deeper

Advanced Analysis

Use specialized models and data-quality reports to investigate specific parts of your genetic dataset.

Population component chart illustrating exclusive admixture models Available

Exclusive Admixture Reports

Explore more than 30 population-mixture models designed for different geographic and historical comparison questions.

  • 30+ comparison models
  • Multiple geographic perspectives
  • Interactive result breakdowns
View report details
X chromosome illustration for population-component analysis Available

X-Chromosome Admixture Report

Examine X-chromosome population-component estimates separately from autosomal results for an additional comparison view.

  • X-chromosome-specific models
  • K9 and K23 estimates
  • Comparison with autosomal patterns
View report details
HLA molecular illustration for population-frequency analysis Available

HLA Heritage Report

Analyze selected HLA variants and compare population-frequency patterns associated with immune-system diversity.

  • Selected HLA variant analysis
  • Population-frequency comparisons
  • Informational immune-system context
View report details
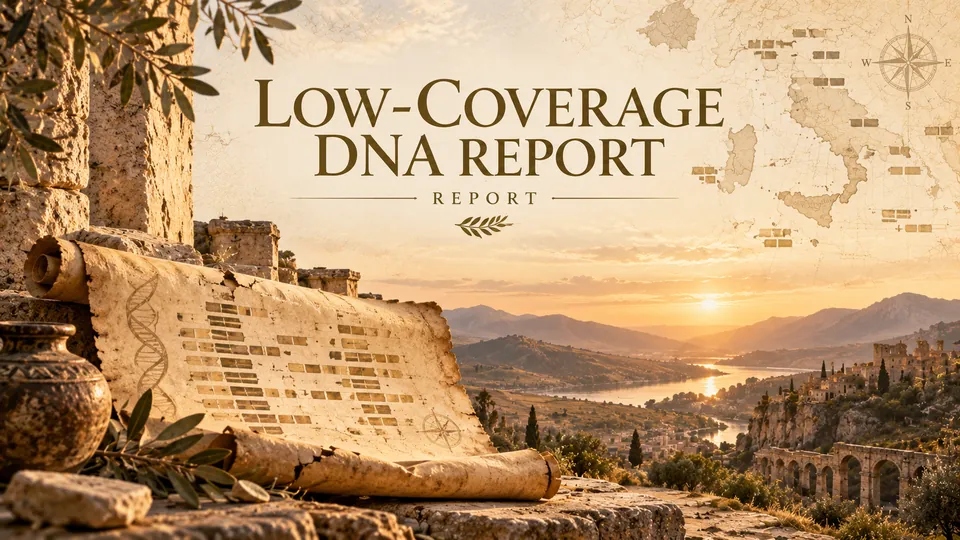
DNA coverage chart illustrating lower-coverage genomic regions Available

Low-Coverage DNA Report

Identify regions with lower SNP coverage so you can understand data limitations before interpreting downstream analyses.

  • Coverage-gap identification
  • Chromosome-level quality view
  • Interpretation guidance
View report details

05 · Compare archaic genomes

Ancient DNA & Archaic Ancestry

Measure similarity to available Neanderthal and Denisovan reference genomes.

Neanderthal reconstruction illustrating archaic genome comparison Available

Neanderthal Report

Measure genetic similarity to Neanderthal reference genomes and review selected variants associated with studied traits.

  • Neanderthal similarity estimate
  • Selected inherited variants
  • Research and trait context
View report details
Denisovan reconstruction illustrating archaic genome comparison Available

Denisovan Report

Measure genetic similarity to available Denisovan reference genomes and explore population-level comparison context.

  • Denisovan similarity estimate
  • Variant-level comparisons
  • Regional research context
View report details

06 · Scientific methodology

How the comparisons are built

Each method answers a different question. Expand the panels to see how the visual models work and what they can support.

Reference panels

Ancient and contemporary samples are organized into comparison panels with geographic, temporal, and archaeological context.

Multiple methods

Chromosomal comparisons, mixture models, PCA-based coordinates, IBS, and haplogroup placement provide complementary views.

Quality and interpretation

Validation and data-quality checks support interpretation, while results remain statistical estimates rather than genealogical proof.

Chromosomal-level analysis

Chromosomal analysis compares smaller windows of your DNA with reference panels instead of relying only on a single global estimate. Where the data supports it, phasing can separate inherited chromosome copies to provide additional context.

Segment-level similarity can identify informative regions, but it does not prove descent from a named person or group.

Admixture analysis

Admixture analysis models a genetic profile as a mixture of selected ancient or contemporary reference components. Percentages show the best fit for that model and reference set, so values can differ between calculators.

Components are model-based similarities, not fixed measures of ethnicity or identity.

G25 coordinates & Oracle analysis

Principal component analysis places a genetic profile in a mathematical coordinate space. G25 uses 25 dimensions, while Oracle searches for nearby reference populations and combinations that minimize distance.

Distance reflects similarity within the selected coordinate model; it is not a genealogical relationship.

comparison point Principal component 1 Principal component 2
Two-dimensional view of a higher-dimensional comparison space
Identity by state (IBS)

IBS analysis identifies allele states or segment patterns shared with ancient and contemporary samples. Longer or repeated matching regions can strengthen a similarity signal when data quality and marker density are sufficient.

IBS similarity alone does not establish a recent common ancestor or direct descent.

Haplogroup analysis

Haplogroup analysis uses Y-DNA or mitochondrial markers to estimate placement on paternal or maternal phylogenetic trees. Branch age ranges and migration maps provide population-history context for that lineage branch.

A haplogroup represents one lineage branch and does not summarize a person's complete ancestry.

RR1aR1bU106P312 illustrative branch placement
Simplified phylogenetic branching with one estimated placement

07 · How it works

Upload, analyze, explore

Choose the report that fits your question, then follow one clear workflow.

  1. 1

    Upload your DNA file

    Use raw data from 23andMe, AncestryDNA, MyHeritage, FamilyTreeDNA, Living DNA, Nebula Genomics, and other supported providers.

    Check file compatibility
  2. 2

    Run the comparison

    The selected method compares the relevant markers with its ancient, historical, contemporary, or lineage reference data.

  3. 3

    Explore the results

    Review interactive visualizations, quality context, and interpretation guidance for the report's statistical estimates.

Processing time

Most reports are generated within 24–48 hours after file upload and order confirmation.

Report access

Purchased reports remain available in your account, including applicable updates to their analysis.

Support

Support is available to help with file compatibility, access, and understanding the report interface.

Back to top