

#1 Closest Match
Meet the Ancient Individual Closest to You
See the sample, era, country, distance score, haplogroups, and historical context behind your strongest ancient similarity.
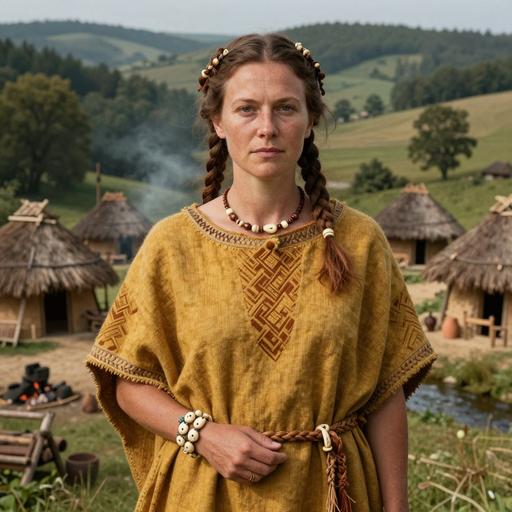


A deep ancestry report that compares your genetic profile with ancient individuals, then turns the results into clear matches, timelines, regions, and interpretation.
Instead of overwhelming you with a database, the report starts with the patterns that matter: your closest match, best ancient blend, time depth, geography, lineages, and plain-language interpretation.
See the sample, era, country, distance score, haplogroups, and historical context behind your strongest ancient similarity.
Meet the ancient individual whose overall genetic profile is most similar to yours.
See the two ancient populations that best combine to explain your genetic signal.
Understand whether your strongest matches cluster in the Neolithic, Bronze Age, Iron Age, or Medieval world.
View where your strongest ancient connections appear across countries and archaeological regions.
Discover mtDNA and Y-DNA lineage echoes when your raw data contains haplogroup information.
Get a guided explanation that turns distances, eras, and regions into a readable personal summary.
The full report uses authenticated ancient samples as anchors, so users can explore matches as people from specific times, regions, and cultures.
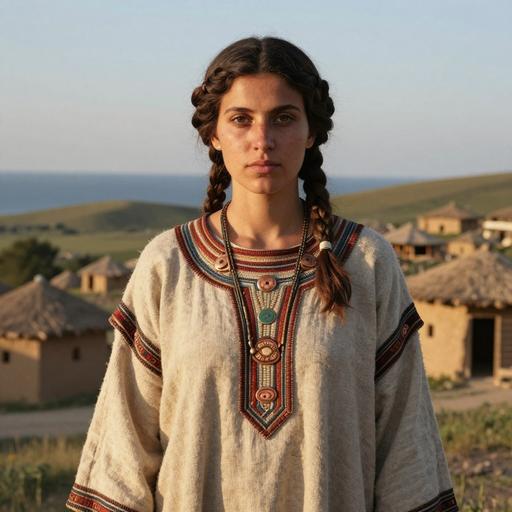
An example of how an individual match is presented with time, place, lineage, and cultural context.
A preview of the Bronze Age migrations and population blends explored in the report.
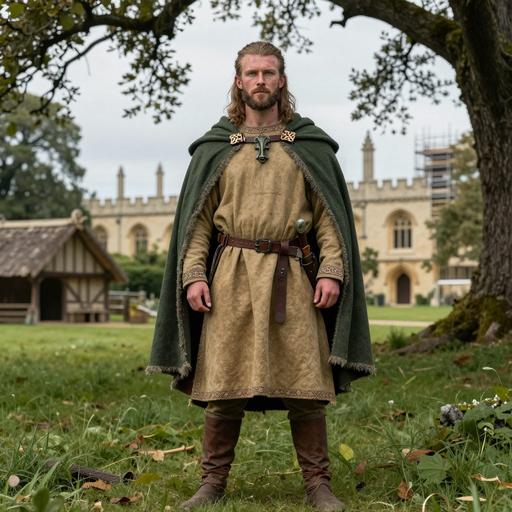
A later historical sample showing how the report moves from deep prehistory into named cultures.
The report is built on a curated panel of authenticated ancient individuals drawn from archaeological publications. Your purchased report ranks the individuals genetically closest to you and places them in time, region, and culture.
Explore the map preview below, or search the complete reference panel in the table. Genetic similarity to these individuals does not mean they are your real ancestors.
Map preview This map shows a preview of 150 of 12850 reference individuals used in this report. Search the complete list in the table below.
| Sample ID | Name | Location | Era | mtDNA | Y-DNA |
|---|
Loading reference individuals…
No reference individuals match your search.
This portrait is an AI-generated speculative reconstruction and may be historically or biologically inaccurate. It is not a photograph of the individual.
The report uses established population genetics tools, then presents the outcome as a ranked, visual, and readable experience.
Your DNA is decomposed into ancestry components that can be compared with the same components in ancient samples.
Principal Component Analysis places your profile alongside ancient populations so broad structure becomes visible.
Distance scores rank ancient individuals and blends by similarity. Lower scores indicate closer overall fit.
The analysis compares against 2,500+ authenticated ancient samples from archaeological publications. The product page gives a light preview; the purchased report focuses on your personal matches, timelines, maps, haplogroups, and summary.
Buy once and keep access to the report. Your results are designed to stay readable as methods and ancient reference data improve.
Modern ethnicity estimates compare you to present-day reference groups. This report compares your genetic profile to ancient samples from archaeological contexts, so the focus is on older population signals and movements.
Distance scores summarize similarity in multi-dimensional genetic space. A lower score means your ADMIXTURE profile is closer to that ancient individual or composite blend.
Yes. The report presents ancient individuals with sample IDs, dates, regions, cultures, portraits when available, and scientific context.
No. It shows similarity to ancient genetic profiles. That is useful for understanding deep population ancestry, but it is not a direct genealogical relationship.
The platform supports raw autosomal DNA files from major testing providers. Results depend on marker coverage and the information available in your uploaded file.
Yes. The report is designed for lifetime access and can benefit as the ancient reference panel and interpretation methods improve.
Start with your closest ancient echoes, then follow the story through time, place, lineages, and interpretation.
Begin Your Ancient Composition Report
DNA Genics has been building ancestry and DNA analysis reports since 2018. Our reports come from years of work with our own reference panels, calculators and ancient-genome comparisons, developed and reviewed by our team. They are not generated on the fly or assembled as a side project. We use AI only in clearly labelled optional features.