The Story
The journey of Y-DNA haplogroup E1B1A1A1
Origins and Evolution
E1B1A1A1 is a subclade within the broader E1b1a (E-M2) paternal tree that emerged in West/Central Africa during the Holocene. Its position downstream of E1B1A1A places it within the suite of lineages that expanded in concert with shifts to food production, population growth, and later the large-scale Bantu-speaking migrations. Based on the phylogenetic position relative to its parent clade and population-genetic evidence for demographic expansions in this region, a reasonable estimate for the origin of E1B1A1A1 is the mid-Holocene (roughly 5–6 kya), though exact dating depends on mutation-rate assumptions and the density of sampled lineages.
Subclades
As an intermediate clade, E1B1A1A1 typically contains further downstream SNP-defined subclades that show regional differentiation. In many cases these downstream branches show a star-like topology consistent with rapid expansions (a pattern often seen in patrilineal expansions). The current phylogeny continues to be refined as more whole Y-chromosome sequences are generated from diverse African populations; therefore specific named downstream markers for E1B1A1A1 can be resolved further with deeper sampling.
Geographical Distribution
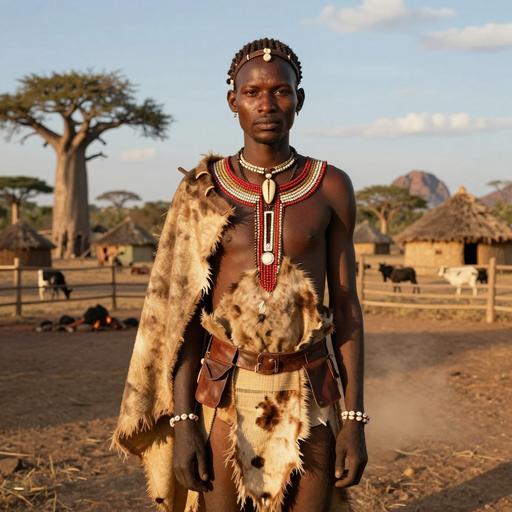
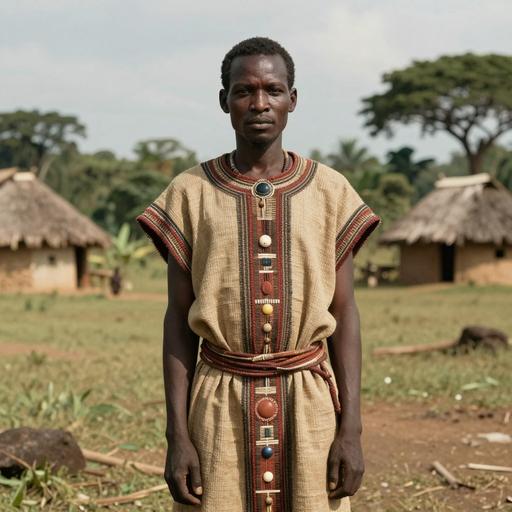
E1B1A1A1 reaches its highest frequencies in West and Central Africa and is widespread across populations descended from those regions. It is common among many West African ethnolinguistic groups (e.g., Yoruba, Akan and other Niger-Congo speakers) and is carried at high to moderate frequencies throughout Bantu-speaking populations of Central, Eastern and Southern Africa (e.g., Kongo, Luba, Nguni groups). Lower-frequency occurrences appear in parts of the Sahel and Lake Chad region, in some Horn and Great Lakes populations, and at low levels in North Africa and southern Europe—reflecting historical gene flow and recent movements. Due to the transatlantic slave trade, E1B1A1A1 is also frequent in African-descended populations of the Americas and the Caribbean.
Historical and Cultural Significance
The distribution and diversity of E1B1A1A1 make it a useful marker for studying Holocene-era demographic processes in sub-Saharan Africa. Its expansion patterns correlate closely with the spread of Bantu languages, agriculture and iron-age societies in much of sub-Saharan Africa. In historical times, the haplogroup's presence in the Atlantic diaspora provides a paternal genetic link between modern African descendant populations in the Americas and their West/Central African source populations. Low-level detectability in North Africa and parts of southern Europe can reflect trade, migration and historical interactions across the Mediterranean and Sahel corridors.
Conclusion
E1B1A1A1 is best understood as one component of the larger E1b1a/E-M2 demographic expansion that reshaped sub-Saharan African paternal diversity in the Holocene. Its geographic pattern—high in West/Central Africa and widespread among Bantu-speaking groups—supports interpretations of population growth and migration beginning several thousand years ago. Continued expansion of high-resolution Y-chromosome sampling and ancient DNA from Africa will refine the internal branching, dates, and finer-scale migration histories of this clade.
Caveat: Age estimates and geographic inferences depend on sampling density, calibration of Y-chromosome mutation rates, and improvements in the phylogeny; future data may adjust the timing and finer-scale distribution described here.
Key Points
- Origins and Evolution
- Subclades
- Geographical Distribution
- Historical and Cultural Significance
- Conclusion