Menu
Currency
Y-DNA Haplogroup • Paternal Lineage

E1B

Y-DNA Haplogroup E1B

~30,000 years ago
Northeast Africa
1 subclades
Scroll to explore
Chapter I

The Story

The journey of Y-DNA haplogroup E1B

Origins and Evolution

Y-DNA haplogroup E1B is a downstream node of the broader haplogroup E1 clade that expanded within Africa after the initial emergence of E1. Estimates for the origin of E1B place it in Northeast/East Africa during the Late Upper Paleolithic to early post-glacial interval (roughly ~30 kya, noting that published age estimates vary by method and marker sets). As a branching point it precedes the major, geographically differentiated subclades that dominate different parts of Africa and later influence surrounding regions.

Evolutionary studies and phylogenetic reconstructions indicate that E1B is ancestral to or closely related with the lineages that later diversified into both the widespread West/Central African lineages and the North African / Mediterranean–Near Eastern lineages. This topology explains why descendant lineages of this node are common across very different ecological and cultural zones.

Subclades

E1B is best understood as an intermediate branching point that gave rise to several major downstream clades (nomenclature varies between different build versions of the Y-tree). Important descendant groups commonly associated with this node include:

  • E-M2 (often listed historically as E1b1a / E-V38 branch) — dominant in West, Central and much of Southern Africa and strongly associated with the Bantu expansion.
  • E-M35 (often listed historically as E1b1b / E-M215 branch) — frequent in Northeast Africa, the Horn, North Africa, parts of the Near East and southern Europe, with many regional subclades (e.g., M78, M81, V13) that have their own demographic histories.

Because nomenclature has changed over time (different research groups use different labels and marker sets), it is important to consult the latest Y-chromosome phylogeny for exact subclade names and SNP definitions. In functional terms, E1B is a transitional node linking deep African diversity with lineages that later spread into adjacent regions.

Geographical Distribution

The descendant lineages that emerged from E1B have a broad distribution:

  • High frequencies across many sub-Saharan populations (via E-M2 and related branches), especially among West and Central African groups and in populations that expanded during the Bantu migrations.
  • High to moderate frequencies in the Horn and Northeast Africa, where several E-M35-derived subclades are common.
  • Significant presence in North Africa and the Sahel, including among Berber (Amazigh) groups where particular subclades (e.g., M81) are frequent.
  • Lower but detectable frequencies in the Near East and southern Europe, reflecting prehistoric connections (Neolithic movements, later Bronze Age and historic gene flow) and the long-term contact across the Mediterranean.
  • Present in the Americas and Caribbean largely due to the transatlantic slave trade, where descendant lineages from sub-Saharan Africa are frequent in African-descended populations.

Regional frequencies and the relative contribution of particular subclades vary considerably; some branches reflect recent demographic expansions (e.g., Bantu-related spreads), while others reflect older Holocene or Late Pleistocene dynamics and migrations.

Historical and Cultural Significance

  • Bantu expansion: Descendant lineages of E1B (notably E-M2 branches) are closely tied to the demographic processes of the Bantu expansion (starting roughly 3–4 kya), which spread agriculture and ironworking across much of sub-Saharan Africa and carried these paternal markers widely.

  • Afroasiatic and North African histories: E-M35-derived lineages (from the broader E1B-associated radiation) are associated with populations speaking Afroasiatic languages in the Horn and parts of North Africa, and with historically documented movements between North Africa, the Near East and southern Europe across the Holocene.

  • Saharan and Neolithic connections: Some subclades show signatures consistent with Saharan and Sahelian Neolithic population processes and later pastoralist dispersals that shaped regional paternal variation.

  • Historical gene flow and diasporas: Mediterranean and Near Eastern presence of certain subclades reflects millennia of contact (trade, migration, colonization), while the presence of sub-Saharan descendant lineages in the Americas reflects recent historical events (transatlantic slave trade).

Conclusion
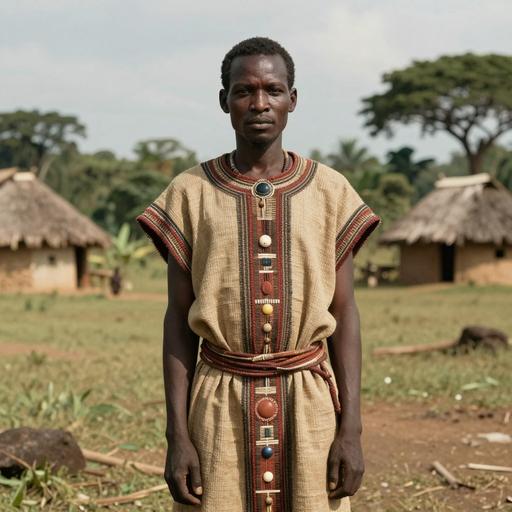
E1B functions as an important intermediate branch within the E1 lineage that links deep East African paternal ancestry to a wide set of descendant lineages with major demographic impacts across Africa and into neighboring regions. Its descendant clades document key episodes in human prehistory and history — from Late Pleistocene and Holocene population structure in Africa to the spread of agriculture, pastoralism and later historic movements. Ongoing refinement of the Y-chromosome phylogeny and broader sampling across Africa continue to clarify the timing, branching order and regional dynamics of E1B and its descendant lineages.

Key Points

  • Origins and Evolution
  • Subclades
  • Geographical Distribution
  • Historical and Cultural Significance
  • Conclusion
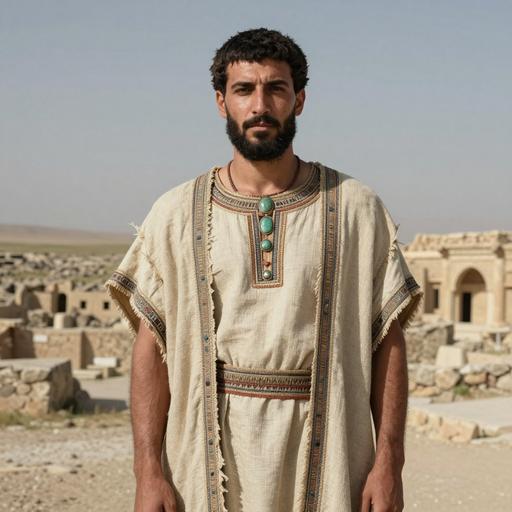
Chapter II

Tree & Relationships

Phylogenetic context and subclades

Evolution Path

This haplogroup's evolutionary journey from its earliest ancestor to the present.

Steps Haplogroup Age Estimate Archaeology Era Time Passed Immediate Descendants Tested Modern Descendants Ancient Connections
1 E1B Current ~30,000 years ago 🦴 Paleolithic 30,000 years 1 1,734 0
2 E1 ~50,000 years ago 🦴 Paleolithic 50,000 years 2 1,825 2
3 E ~50,000 years ago 🦴 Paleolithic 50,000 years 3 1,968 3

Siblings (1)

Other branches from the same parent haplogroup

Chapter III

Where in the World

Geographic distribution and modern presence

Place of Origin

Northeast Africa

Modern Distribution

The populations where Y-DNA haplogroup E1B is found include:

  1. Yoruba and other West African groups
  2. Bantu-speaking populations across Central, Eastern and Southern Africa
  3. Mande and West African coastal groups
  4. Ethiopian, Somali and Horn of Africa populations
  5. Berber (Amazigh) groups of North Africa
  6. Levantine and Near Eastern populations (at lower frequencies)
  7. Southern European groups in Mediterranean regions (e.g., Sicily, Iberia) at low–moderate frequencies
  8. African-descended populations in the Americas and Caribbean (via transatlantic slave trade)

Regional Presence

Eastern Africa High
Northern Africa High
Western Africa Moderate
Central Africa Low
Western Asia / Near East Moderate
Southern Europe Low
North America (diaspora) Low
Northeast Africa High
Southern Africa Moderate
CHAPTER IV

When in Time

Your haplogroup in the context of human history

~30k years ago

Haplogroup E1B

Your Y-DNA haplogroup emerged in Northeast Africa

Northeast Africa
~20k years ago

Last Glacial Maximum

Peak of the last ice age, populations isolated

~10k years ago

Neolithic Revolution

Agriculture begins, settled communities form

~5k years ago

Bronze Age

Metalworking, writing, and early civilizations

~3k years ago

Iron Age

Iron tools, expanded trade networks

~2k years ago

Classical Antiquity

Greek and Roman civilizations flourish

Present

Present Day

Modern era

Your Haplogroup
Historical Era
Chapter IV-B

Linked Cultures

Ancient cultures associated with Y-DNA haplogroup E1B

Cultural Heritage

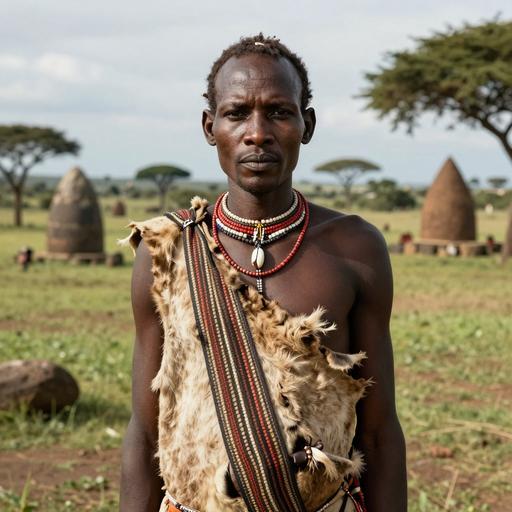
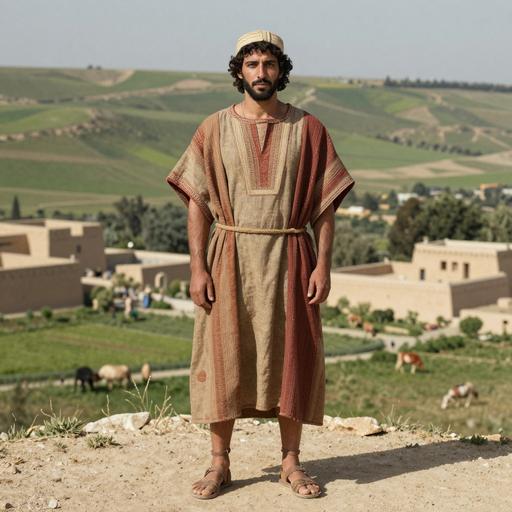
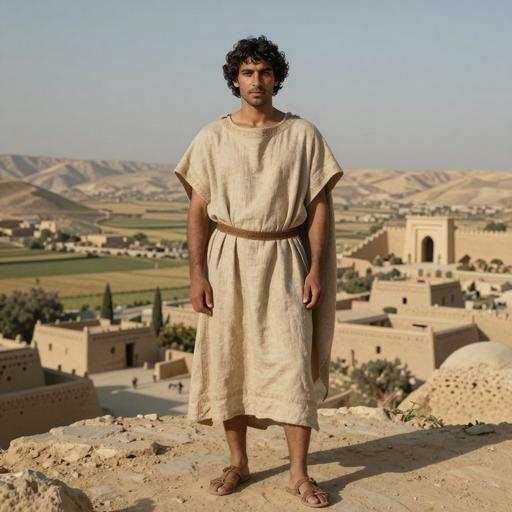
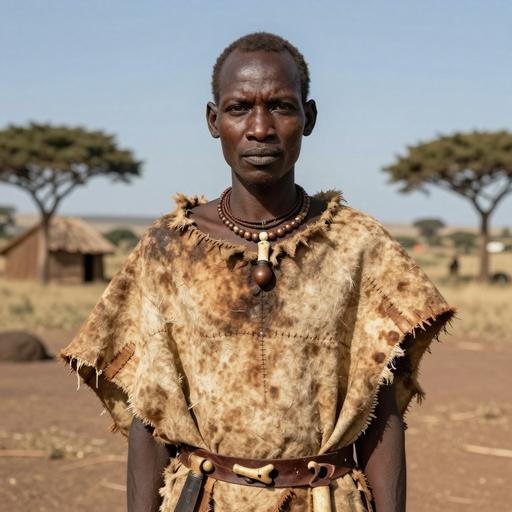
These ancient cultures have been linked to haplogroup E1B based on matching ancient DNA samples from archaeological excavations. The presence of this haplogroup in these cultures provides insights into the migrations and population movements of populations carrying this haplogroup.

Iberomaurusian Natufian Roman Provincial
Culture assignments are based on archaeological context of ancient DNA samples and may represent regional associations during specific time periods.
Chapter V

Sample Catalog

36 subclade carriers of haplogroup E1B (no exact E1B samples sequenced yet)

36 / 36 samples
Portrait Sample Country Era Date Culture Y-DNA Match
Portrait of ancient individual I13977 from Tanzania, dated 47 BCE - 113 BCE
I13977
Tanzania Prehistoric in Tanzania 47 BCE - 113 BCE Tanzanian Prehistoric E1b1b1b2b2 Downstream
Portrait of ancient individual I8808 from Kenya, dated 84 BCE - 211 BCE
I8808
Kenya Late Stone Age in Kenya 84 BCE - 211 BCE LSA Kenya E1b1b1a1b2 Downstream
Portrait of ancient individual I13762 from Tanzania, dated 200 BCE - 1 BCE
I13762
Tanzania Prehistoric and Iron Age in Tanzania 200 BCE - 1 BCE Tanzania Multi-Period E1b1b1b2b2a1 Downstream
Portrait of ancient individual I12384 from Kenya, dated 215 BCE - 326 BCE
I12384
Kenya Pastoral Neolithic in Kenya 215 BCE - 326 BCE Pastoral Neolithic E1b1b1b2b2a1 Downstream
Portrait of ancient individual I13972 from Tanzania, dated 245 CE - 368 CE
I13972
Tanzania Prehistoric in Tanzania 245 CE - 368 CE Tanzanian Prehistoric E1b1b1b2b2 Downstream
Portrait of ancient individual IND009 from Germany, dated 400 CE - 800 CE
IND009
Germany Saxon Early Medieval Alt Inden, Germany 400 CE - 800 CE Saxon Culture E1b1b1a1b1a Downstream
Portrait of ancient individual MOL001 from Kenya, dated 437 BCE - 600 BCE
MOL001
Kenya Molo Cave Pastoral Neolithic in Kenya 437 BCE - 600 BCE Molo Cave Culture E1b1b1b2b Downstream
Portrait of ancient individual HYR002 from Kenya, dated 513 BCE - 386 BCE
HYR002
Kenya Hyrax Hill Pastoral Neolithic in Kenya 513 BCE - 386 BCE Hyrax Hill E1b1b1b2b Downstream
Portrait of ancient individual CL38 from Italy, dated 580 CE - 630 CE
CL38
Italy Early Medieval Langobards, Northern Italy 580 CE - 630 CE Langobard E1b1b1a1b1a3 Downstream
Portrait of ancient individual gun012 from Canary Islands, dated 593 CE - 660 CE
gun012
Canary Islands The Guanche People of the Canary Islands 593 CE - 660 CE Guanche E1b1b1b1a1 Downstream
Chapter VI

Carrier Distribution Map

Geographic distribution of 36 ancient DNA samples (direct and subclade carriers of E1B)

Subclade carrier
Time Period Filter
All Time Periods
Showing all samples
Chapter VII

Temporal Distribution

Distribution of carriers across archaeological periods

Chapter VIII

Geographic Distribution

Distribution by country of origin (direct and subclade carriers shown by default)

Chapter IX

Country × Era Distribution

Cross-tabulation of carrier countries and archaeological periods (direct and subclade carriers shown by default)

Data

Data & Provenance

Source information and data quality

Last Updated 2026-06-15
Confidence Score 50/100
Coverage Low
Data Source

We use the latest phylotree for YDNA haplogroup classification and data.