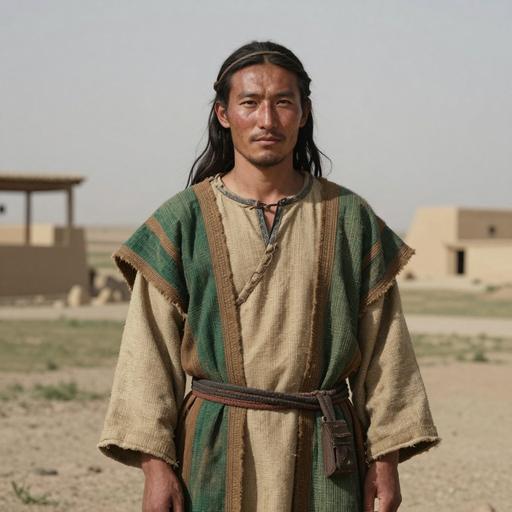
The Story
The journey of Y-DNA haplogroup J1A
Origins and Evolution
Y-DNA haplogroup J1A is an intermediate paternal lineage within haplogroup J1, which itself belongs to the broader haplogroup J branch of the Y-chromosome tree. Because J1 is most strongly associated with the Near East and Arabian Peninsula, J1A is best interpreted as a regional subclade that emerged during the later phases of West Asian population diversification, after the initial formation of J1 but before many of the historically visible expansions of its descendant branches.
The exact age and internal structure of J1A depend on the phylogenetic framework used by different testing companies and publications, but as a subclade of J1 it is generally expected to have arisen in Holocene West Asia, likely in the context of post-glacial population growth, Neolithic and post-Neolithic mobility, and subsequent Bronze Age and Iron Age demographic processes. Its presence in multiple neighboring regions is consistent with repeated gene flow across the Levant, Mesopotamia, Anatolia, Arabia, and the Caucasus.
Subclades
J1A is an intermediate clade, meaning it sits between a broader parent lineage and more specific downstream branches. In practical terms, this makes it a useful marker for connecting broader J1 phylogeography to local or regional descendant lineages.
Because nomenclature can vary between datasets, the exact downstream branches under J1A may differ in how they are labeled across academic and consumer-testing trees. In general, the most important point is that J1A represents one step of refinement within J1, not a terminal or especially derived branch by itself.
Geographical Distribution
J1A is expected to be found primarily in West Asia and the eastern Mediterranean, with the highest levels of diversity and continuity most likely in the Near East. It is compatible with the broader distribution of J1, which is frequent in:
- Levantine populations
- Arabian Peninsula populations
- Anatolian populations
- Caucasus populations
- Mesopotamian populations
Beyond its core range, J1A may also appear at lower frequencies in Greek and southern Italian populations, Balkan populations, North African populations, Jewish populations, and some South Asian populations. These occurrences are best understood as the result of ancient and historical migration networks, including trade, urban expansion, imperial movements, and population dispersals around the Mediterranean and the Indian Ocean.
Historical and Cultural Significance
Although a specific archaeological culture cannot be assigned to J1A with confidence in the same way as some ancient DNA-linked European lineages, the broader J1 background is often discussed in relation to Neolithic Near Eastern expansion, pastoralist mobility, and later Bronze Age and Iron Age population movements.
J1-derived lineages are especially important in the study of Arabian, Levantine, and Caucasian population history, and they also appear in historical populations associated with Semitic-speaking regions, ancient trade corridors, and the spread of West Asian paternal ancestry into surrounding areas. J1A likely participated in these same demographic processes, serving as one branch among many that contributed to the complex paternal landscape of the Near East.
Relationship to Other Haplogroups
Within the paternal phylogeny, J1A is most closely related to other J1 lineages and more distantly to J2, the other major branch of haplogroup J. While J1 and J2 share a deep ancestry, they show different regional emphases: J1 is especially associated with Arabia and the Levant, while J2 is more strongly linked to the Fertile Crescent, Anatolia, and the Mediterranean.
J1A may also co-occur in populations where other West Asian Y-DNA lineages are common, including E1b1b, G2a, J2, R1b, and T. These co-occurrences reflect the mixed paternal heritage of Near Eastern, Mediterranean, and Caucasus populations rather than any direct biological relationship beyond shared regional history.
Conclusion
Y-DNA haplogroup J1A is a regional subclade within a major Near Eastern paternal lineage. Its distribution and phylogenetic position suggest a history shaped by Holocene West Asian diversification, followed by repeated expansions and admixture across the Near East, Arabia, the Mediterranean, and neighboring regions.
Key Points
- Origins and Evolution
- Subclades
- Geographical Distribution
- Historical and Cultural Significance
- Relationship to Other Haplogroups