The Story
The journey of Y-DNA haplogroup E
Origins and Evolution
Haplogroup E (downstream of DE) is one of the primary paternal lineages associated with modern African populations. It is generally estimated to have arisen in East or North-East Africa during the Upper Paleolithic, roughly ~40–70 thousand years ago (commonly cited central estimates near 50 kya). E split from its sister clade D (the DE sibling found primarily in parts of Asia) after the DE ancestral node, and then diversified within Africa into several major branches.
The phylogenetic branching within E produced long-lived and geographically structured subclades. This internal diversification reflects both deep Paleolithic population structure in Africa and later demographic events (Neolithic, pastoralist, and historical expansions) that reshaped the distribution of E sublineages.
Subclades (if applicable)
Major subclades of haplogroup E include:
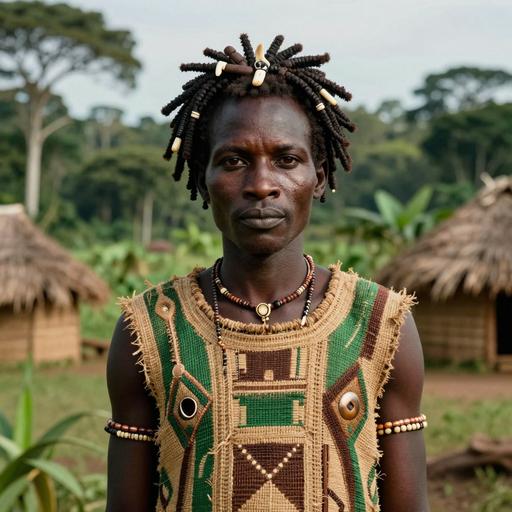
- E‑M2 (often called E1b1a) — predominant across much of sub‑Saharan West, Central and Southern Africa; closely associated with the Bantu expansions over the last ~3–5 kya.
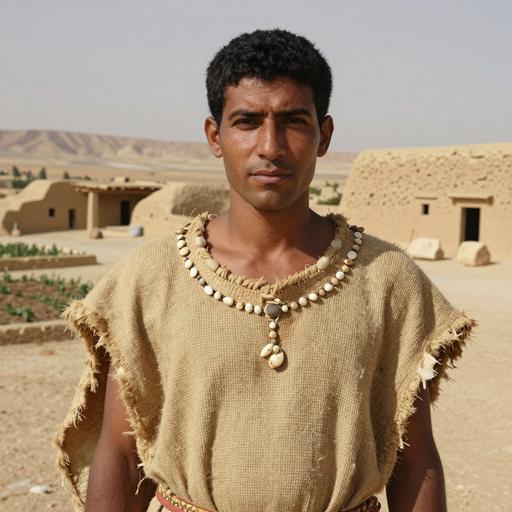
- E‑M35 / E1b1b — frequent in North Africa, the Horn of Africa, parts of the Near East and southern Europe; internally diverse with lineages (e.g., E‑M78, E‑M81) that have been linked to Neolithic and later movements across the Mediterranean and North Africa.
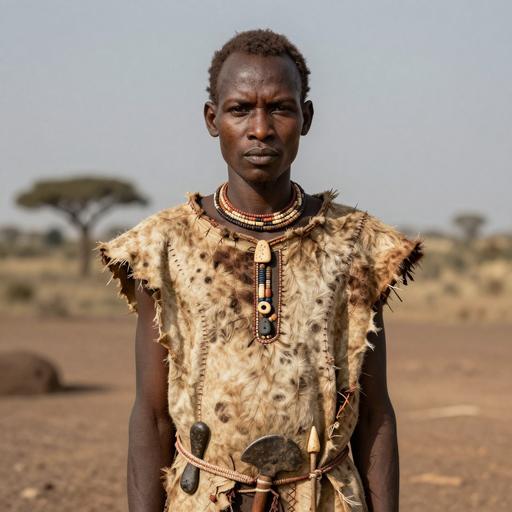
- E‑M329 and other East African branches — more restricted to the Horn and adjacent East African populations and indicative of ancient East African population structure.
These subclades have different geographic focal points and demographic histories: E‑M2 is strongly tied to relatively recent demographic expansions (Bantu), while various E‑M35 lineages show older Neolithic/pastoralist associations and complex movements into Eurasia.
Geographical Distribution
Overall, haplogroup E is the dominant Y‑DNA lineage across much of sub‑Saharan Africa. Its distribution shows regional structure by subclade: E‑M2 peaks in West and Central African groups and in populations descended from them (including the African diaspora), whereas E‑M35 and its sublineages are common in North Africa, the Horn of Africa, parts of the Near East, and show measurable frequencies in southern Europe (Mediterranean) due to prehistoric and historic gene flow.
Outside Africa, E lineages appear in the Near East and the Mediterranean from Neolithic and later contacts, and in the Americas largely as a consequence of the transatlantic slave trade, in addition to more limited historic movements (e.g., Islamic-era North African gene flow into Iberia).
Historical and Cultural Significance
Haplogroup E and its subclades are tied to several major demographic processes in African and adjacent regions:
- Bantu expansion: The dramatic spread of agricultural and iron‑working Bantu‑speaking populations from a homeland in West/Central Africa (beginning ~3–5 kya) carried E‑M2 widely across sub‑Saharan Africa, greatly shaping the modern genetic landscape of the region.
- Neolithic and pastoral expansions: Some E‑M35 lineages correspond with the spread of pastoralist and agricultural practices in northeastern Africa and into the Mediterranean and Near East during the Holocene.
- Historic translocations: Trade, conquest and the transatlantic slave trade redistributed E lineages beyond Africa — notably into the Americas and parts of Europe.
Because of its prevalence and internal diversity, haplogroup E is important for reconstructing African population history, the spread of language families (e.g., Niger‑Congo/Bantu, Afroasiatic), and interactions between Africa and neighboring regions.
Conclusion
Y‑DNA haplogroup E is a cornerstone of paternal ancestry for African populations and a key marker for studying African demographic history. Its origin within Africa from a DE ancestor and subsequent branching into regionally distinct subclades explain both its high continental frequency and its varied external footprints in the Near East, southern Europe, and the Americas. Genetic, archaeological, and linguistic evidence taken together show that E's distribution reflects deep Paleolithic roots plus substantial Holocene and historic movements that shaped modern populations.
Key Points
- Origins and Evolution
- Subclades (if applicable)
- Geographical Distribution
- Historical and Cultural Significance
- Conclusion