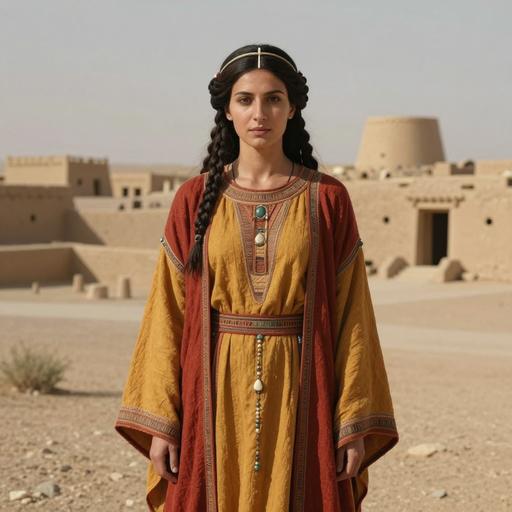
mtDNA · Maternal lineage

R30

mtDNA Haplogroup R30

A reference profile for one lineage branch. Shared haplogroups do not establish a family relationship or cultural identity.

Reference profile

Branch background

Historical context for mtDNA lineage branch R30

Origins and Evolution

Haplogroup R30 is a derived subclade within the broader mtDNA lineage R3, itself a branch of macro-haplogroup R. Given the placement of R30 as a downstream branch of R3, its origin is best placed within the South Asian phylogeographic context where R3 diversified during the Upper Paleolithic. Molecular-clock estimates for descendant subclades and the archaeology of the region suggest an emergence in the Late Pleistocene to Early Holocene (roughly ~15 kya, with uncertainty). As with many South Asian-specific R-lineages, R30 represents local continuity and in situ diversification rather than a signal of recent large-scale migrations from outside the subcontinent.

Subclades

R30 is itself a relatively narrowly distributed and rare clade; published population surveys and sequence databases report few named downstream subclades, and the internal structure is still poorly characterized due to small sample sizes. Where complete mitogenomes are available, R30 samples can show private mutations that may define local sublineages restricted to particular castes, tribes, or regions. Continued mitogenome sequencing of South Asian populations is needed to resolve internal branching and coalescence times.

Geographical Distribution

R30 is most consistently detected at low-to-moderate frequencies within the Indian subcontinent, with sporadic detections in neighboring regions. Population genetic surveys indicate the highest relative incidence in diverse South Asian groups (including tribal and caste populations), occasional presence in Pakistan and Sri Lanka, and rare occurrences recorded in Central, West and Southeast Asia — plausibly reflecting prehistoric gene flow, trade, or more recent movements. Modern diasporic communities of South Asian origin also occasionally carry R30 lineages outside Asia.

Historical and Cultural Significance

Because R30 likely originated well before the major Holocene cultural complexes, it should be considered part of the deep maternal substrate of South Asia rather than a marker of any single archaeological horizon. Its persistence into the Neolithic, Bronze Age and historic periods would be consistent with observed mitochondrial continuity across many South Asian regions. In archaeological contexts, isolated detections of closely related R-lineages have been interpreted as evidence for long-term regional maternal continuity through transitions such as the Mesolithic-to-Neolithic and the emergence of complex societies (e.g., those associated with Mehrgarh and later urban centers), but R30-specific ancient DNA evidence remains limited, so direct ties to named archaeological cultures remain tentative.

Conclusion

R30 is a rare but informative South Asian mtDNA lineage that exemplifies the subcontinent's deep maternal diversity. Its scarcity in published datasets limits precise dating and fine-scale mapping, but its phylogenetic position within R3 supports a Late Pleistocene/Early Holocene origin in South Asia and a history of local continuity with occasional spread beyond the region. Expanded mitogenome sampling and additional ancient DNA from South Asia will be required to refine the internal structure, age, and archaeological associations of R30.

Key Points

  • Origins and Evolution
  • Subclades
  • Geographical Distribution
  • Historical and Cultural Significance
  • Conclusion
Reference profile

Tree & Relationships

Phylogenetic context and subclades

Evolution Path

Follow the recorded parent branches toward R30. Dates are estimates and can change as reference data is revised.

Steps Haplogroup Age Estimate Archaeology Era Time Passed Immediate Descendants Tested Modern Descendants Ancient Connections
1 R30 Current ~15,000 years ago Mesolithic 15,000 years 2 37 0
2 R ~55,000 years ago Paleolithic 55,000 years 17 22,830 57
3 NA - - - 1 22,830 0
4 N ~60,000 years ago Paleolithic 60,000 years 16 26,150 13
5 L3 ~70,000 years ago Paleolithic 70,000 years 7 30,162 6
6 L3'4 - - - 2 30,212 0
7 L3'4'6 - - - 2 30,216 0
8 L2'3'4'6 - - - 2 31,333 0
9 L2'3'4'5'6'7 - - - 2 31,349 0
10 L1'2'3'4'5'6'7 - - - 2 31,852 0
11 L ~160,000 years ago Paleolithic 160,000 years 2 32,236 5
Reference profile

Where in the World

Geographic distribution and modern presence

Recorded origin

South Asia

Modern Distribution

The populations where mtDNA haplogroup R30 is found include:

  1. Diverse populations of the Indian subcontinent (including tribal groups, caste communities, and regional populations)
  2. Pakistani population samples (sporadic detections)
  3. Sri Lankan populations (rare detections)
  4. Central Asian groups (occasional detections in some Uzbek/Tajik samples)
  5. Populations on the Iranian plateau and parts of West Asia (low frequency, occasional)
  6. Southeast Asian populations in limited surveys (rare occurrences)
  7. Diasporic South Asian communities globally (low frequency detections)
Historical context

A branch through time

Estimated formation in a broad historical timeline. Period markers provide context and do not imply a connection with particular cultures.

  1. ~20k years ago

    Last Glacial Maximum

    Peak of the last ice age, populations isolated

  2. ~15k years ago

    Haplogroup R30

    Estimated formation of this mtDNA branch; dates and locations are reference estimates.

    This branch
  3. ~10k years ago

    Neolithic Revolution

    Agriculture begins, settled communities form

  4. ~5k years ago

    Bronze Age

    Metalworking, writing, and early civilizations

  5. ~3k years ago

    Iron Age

    Iron tools, expanded trade networks

  6. ~2.5k years ago

    Classical Antiquity

    Greek and Roman civilizations flourish

  7. Present

    Present Day

    Modern era

Reference profile

Archaeological context

Recorded archaeological associations for mtDNA branch R30

Recorded associations

These labels describe archaeological contexts recorded for reference samples linked to R30. An association does not establish that all carriers belonged to a culture or followed a particular migration route.

Afanasievo Culture Boisman Cambodian Iron Age Ganj Dareh Culture Linear Pottery Culture Russia_Omsk_Eneolithic_Chernoozersky Santa Rosa Island Culture Sardinian Neolithic Shahr-i Sokhta Culture Taiwanese Iron Ust-Ishim Culture
Culture assignments are based on archaeological context of ancient DNA samples and may represent regional associations during specific time periods.
Reference profile

Sample Catalog

2 direct carriers and 8 subclade carriers of haplogroup R30

10 shown · 10 matching samples

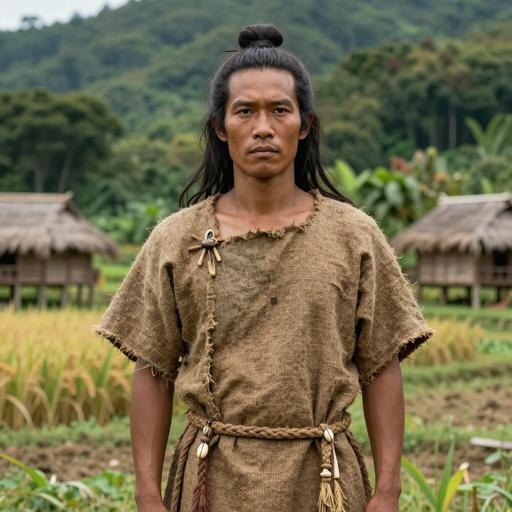
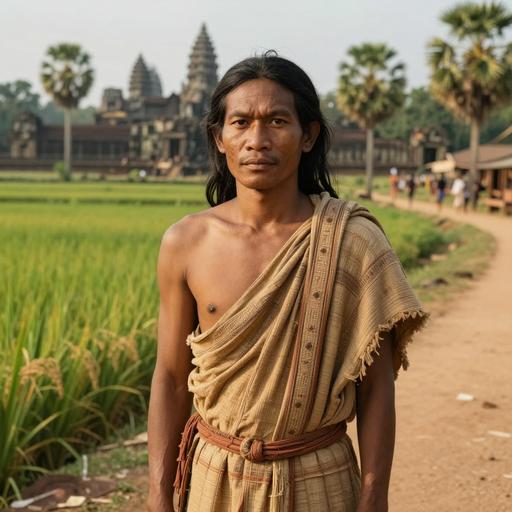
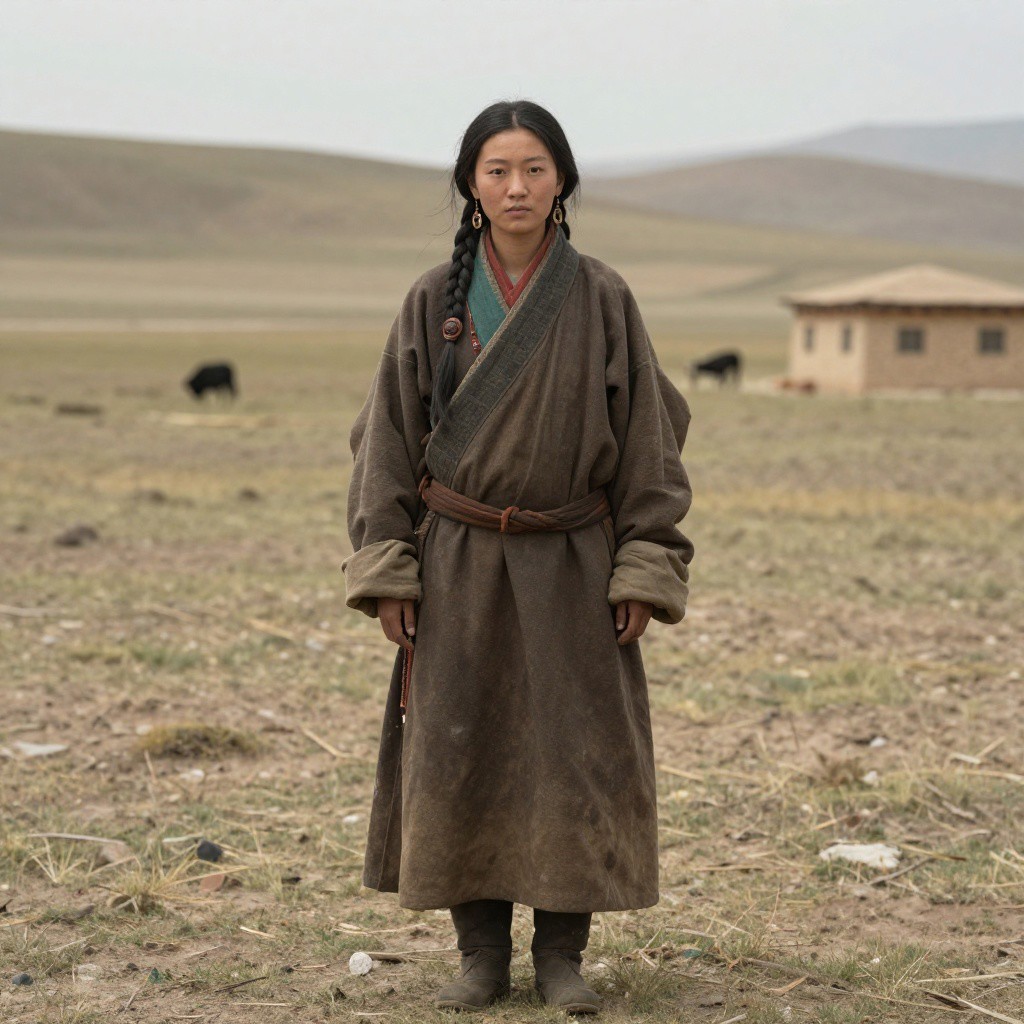
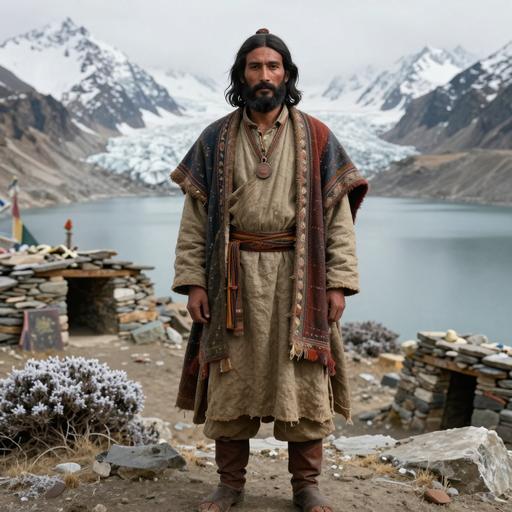
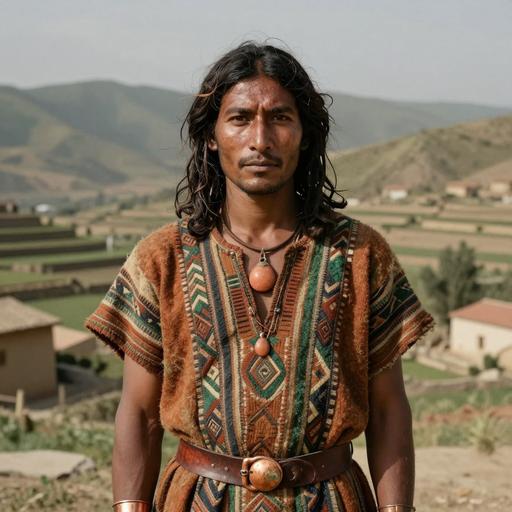
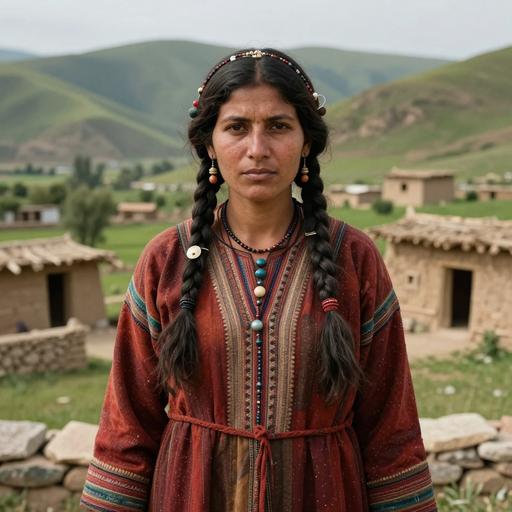
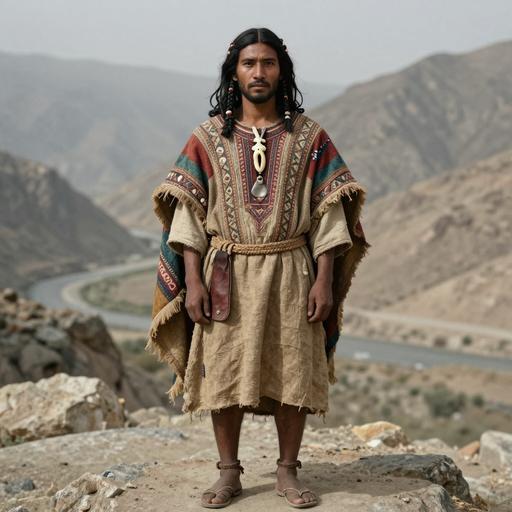
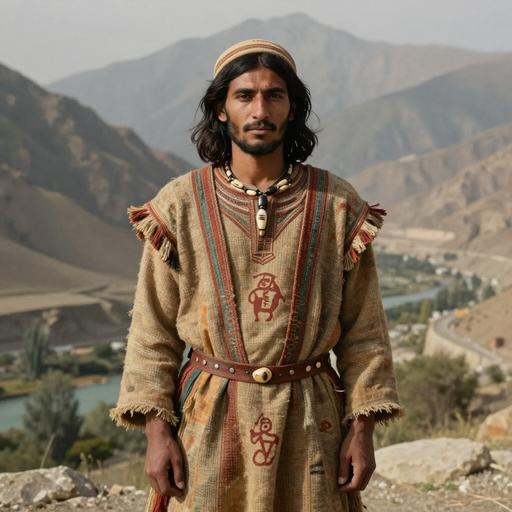
Portraits are AI-generated illustrations. Sample labels and accession IDs identify the reference records.

Portrait Sample Country Era Date Culture mtDNA Match
AI-generated illustrative portrait of IA individual, Hanben. Blihun site, Taiwan (1-800 CE)
Sample ID: I8076
Taiwan Iron Age Taiwan 1-800 CE Taiwanese Iron R30 Direct
AI-generated illustrative portrait of IA individual, Vat Komnou (Angkor Borei), Cambodia (78-234 CE)
Sample ID: I1680
Cambodia Cambodia IA 78-234 calCE (1885±30 BP, Poz-81120) Cambodian Iron Age R30 Direct
AI-generated illustrative portrait of Historic H individual, Swat Valley. Barikot, Pakistan (46 BCE-66 CE)
Sample ID: I7714
Pakistan Historic Barikot 46 calBCE - 66 calCE (2005±20 BP, PSUAMS-6207) Barikot R30b1 Subclade
AI-generated illustrative portrait of Tibet Sangdalongguo IA individual, Sangdalongguo (Tibet, Ngari Prefecture), China (350-50 BCE)
Sample ID: SDLG8
China China Tibet Sangdalongguo IA 350-50 BCE China_Tibet_Sangdalongguo_IA R30b1 Subclade
AI-generated illustrative portrait of Roopkund- A individual, Uttaranchal. Himalaya. Roopkund, India (774-885 CE)
Sample ID: I6942
India India Roopkund A 774-885 calCE (1200±20 BP, PSUAMS-5469) Roopkund Culture R30b2a Subclade
AI-generated illustrative portrait of IA individual, Swat Valley. Loebanr, Pakistan (1,000-800 BCE)
Sample ID: I10001
Pakistan The Loebanr Iron Age Culture of Pakistan 1000-800 BCE Loebanr Culture R30b1 Subclade
AI-generated illustrative portrait of IA individual, Swat Valley. Loebanr, Pakistan (1,000-800 BCE)
Sample ID: I12985
Pakistan The Loebanr Iron Age Culture of Pakistan 1000-800 BCE Loebanr Culture R30b1 Subclade
AI-generated illustrative portrait of IA individual, Swat Valley. Katelai, Pakistan (1,000-800 BCE)
Sample ID: I12447
Pakistan The Pakistan Katelai Iron Age Culture 1000-800 BCE Katelai Culture R30b1 Subclade
AI-generated illustrative portrait of IA individual, Swat Valley. Gogdara, Pakistan (1,100-900 BCE)
Sample ID: I8194
Pakistan Gogdara Iron Age Petroglyphs in Swat Valley, Pakistan 1100-900 BCE Gogdara Culture R30a1b Subclade
AI-generated illustrative portrait of Shahri Sokhta BA1-1 individual, Seistan. Shahr-i Sokhta, Iran (2,901-2,706 BCE)
Sample ID: I11479
Iran Shahr-i Sokhta Bronze Age 2901-2706 calBCE (4228±18 BP) [R_combine: (4210±25 BP, PSUAMS-5716), (4245±25 BP, PSUAMS-4779)] Shahr-i Sokhta Culture R30b Subclade
MATERNAL LINEAGE · ANCIENT DNA

Ancient lineage evidence map

Follow parent clades toward this branch and explore where ancient carriers were found.

Loading ancient observations…

Markers are archaeological find locations. A dashed connector is an uncertain, proposed geographic transition between consecutive branches supported by multiple dated observations; it is not an exact travel route, birthplace or proof of direct descent. Parent-clade samples may belong to other descendant branches. Gaps remain where evidence is insufficient. Sample dates differ from haplogroup formation dates.

Reference profile

Carrier Distribution Map

Geographic distribution of 10 ancient DNA samples (direct and subclade carriers of R30)

Direct carrier Subclade carrier
Time Period Filter
All Time Periods
Showing all samples
Reference profile

Temporal Distribution

Distribution of carriers across archaeological periods

Reference profile

Geographic Distribution

Counts by recorded sample country. These reflect the available reference selection, not population frequencies.

Reference profile

Country × Era Distribution

Compare recorded sample counts across countries and archaeological periods. Select a populated cell to inspect a sample.

Data

Data & Provenance

Source information and data quality

Last Updated 2026-02-16
Confidence Score 50/100
Coverage Low

Data Source

Classification, estimated dates and geographic context reflect the recorded reference data and may change as evidence is revised. Sample coverage is uneven; recorded locations and archaeological associations do not establish personal origin or cultural identity.

A haplogroup follows one maternal or paternal line. The branch prediction depends on which markers the DNA file contains. How our analysis works