mtDNA · Maternal lineage

S2

mtDNA Haplogroup S2

A reference profile for one lineage branch. Shared haplogroups do not establish a family relationship or cultural identity.

Reference profile

Branch background

Historical context for mtDNA lineage branch S2

Origins and Evolution

mtDNA haplogroup S2 is a subclade of the broader haplogroup S, a lineage long associated with the first modern human settlers of Sahul (the Pleistocene landmass including New Guinea and Australia). S itself likely arose during or soon after the initial migration into Island Southeast Asia and Sahul; S2 represents a later branching within that regional diversity. Based on phylogenetic position and molecular-clock estimates for S sublineages, S2 most likely diversified in Near Oceania during the Late Pleistocene to early Holocene (tens of thousands of years ago), reflecting deep maternal continuity in Papuan and Australian populations.

Genetic surveys and complete mitochondrial sequences show S2 carries defining mutations that place it distinctly within the S tree, and its internal diversity indicates an ancient local history rather than recent introduction from outside the region.

Subclades

Researchers have identified internal structure within S2 in population-level sequencing work; reported sublineages (for example, described as S2a, S2b in some studies) reflect geographic partitioning between mainland New Guinea, adjacent islands, and Australian Aboriginal groups. These subclades are useful for tracing microgeographic differentiation and maternal continuity across islands and highland-lowland ecologies in Melanesia.

Geographical Distribution

S2 is primarily concentrated in Near Oceania with highest frequencies observed in parts of Papua New Guinea and detectable presence among Aboriginal Australian samples and some neighboring Melanesian island populations. Occurrences outside this core area are rare and generally reflect either ancient low-frequency dispersals or modern admixture. The distribution pattern—localized high frequency and deep diversity in New Guinea/Australia—supports a scenario of early settlement followed by long-term isolation and regional differentiation.

Historical and Cultural Significance

The presence of S2 among Papuan and Aboriginal Australian groups ties it to the earliest human expansions into Sahul and the subsequent long-term persistence of hunter-gatherer populations in the region. While archaeological cultures common in Eurasia (e.g., Neolithic farming complexes) are not directly linked to S2, the haplogroup contributes to reconstructing pre-agricultural population structure in Oceania. In later periods, Austronesian expansions and Lapita-associated movements introduced other maternal lineages (e.g., B4a1a) into Near Oceania; S2 generally represents indigenous maternal continuity that persisted alongside or beneath these incoming signatures.

Conclusion

mtDNA haplogroup S2 is an ancient, regionally important maternal lineage in Oceania that reflects deep Pleistocene and early Holocene population history in Sahul. Its distribution and internal diversity make it a valuable marker for studies of early human settlement, local differentiation in New Guinea and Australia, and the enduring legacy of pre-Neolithic populations in the Pacific.

Key Points

  • Origins and Evolution
  • Subclades
  • Geographical Distribution
  • Historical and Cultural Significance
  • Conclusion
Reference profile

Tree & Relationships

Phylogenetic context and subclades

Evolution Path

Follow the recorded parent branches toward S2. Dates are estimates and can change as reference data is revised.

Steps Haplogroup Age Estimate Archaeology Era Time Passed Immediate Descendants Tested Modern Descendants Ancient Connections
1 S2 Current ~28,000 years ago Paleolithic 28,000 years 2 3 0
2 S ~50,000 years ago Paleolithic 50,000 years 2 279 0
3 N ~60,000 years ago Paleolithic 60,000 years 16 26,150 13
4 L3 ~70,000 years ago Paleolithic 70,000 years 7 30,162 6
5 L3'4 - - - 2 30,212 0
6 L3'4'6 - - - 2 30,216 0
7 L2'3'4'6 - - - 2 31,333 0
8 L2'3'4'5'6'7 - - - 2 31,349 0
9 L1'2'3'4'5'6'7 - - - 2 31,852 0
10 L ~160,000 years ago Paleolithic 160,000 years 2 32,236 5

Siblings (1)

Other branches from the same parent haplogroup

Reference profile

Where in the World

Geographic distribution and modern presence

Recorded origin

Island Southeast Asia / New Guinea (Sahul)

Modern Distribution

The populations where mtDNA haplogroup S2 is found include:

  1. Indigenous populations of Papua New Guinea
  2. Indigenous (Aboriginal) populations of Australia
  3. Populations of Island Melanesia (e.g., Solomon Islands and nearby islands)
  4. Torres Strait Islander groups (at low to moderate frequencies)
  5. Very occasional occurrences in nearby Island Southeast Asia reflecting historical contact or limited dispersal
Historical context

A branch through time

Estimated formation in a broad historical timeline. Period markers provide context and do not imply a connection with particular cultures.

  1. ~28k years ago

    Haplogroup S2

    Estimated formation of this mtDNA branch; dates and locations are reference estimates.

    This branch
  2. ~20k years ago

    Last Glacial Maximum

    Peak of the last ice age, populations isolated

  3. ~10k years ago

    Neolithic Revolution

    Agriculture begins, settled communities form

  4. ~5k years ago

    Bronze Age

    Metalworking, writing, and early civilizations

  5. ~3k years ago

    Iron Age

    Iron tools, expanded trade networks

  6. ~2.5k years ago

    Classical Antiquity

    Greek and Roman civilizations flourish

  7. Present

    Present Day

    Modern era

Reference profile

Archaeological context

Recorded archaeological associations for mtDNA branch S2

Recorded associations

These labels describe archaeological contexts recorded for reference samples linked to S2. An association does not establish that all carriers belonged to a culture or followed a particular migration route.

Australia_PreEuropean NSW Aboriginal
Culture assignments are based on archaeological context of ancient DNA samples and may represent regional associations during specific time periods.
Reference profile

Sample Catalog

3 subclade carriers of haplogroup S2 (no direct carriers in the current reference selection)

3 shown · 3 matching samples

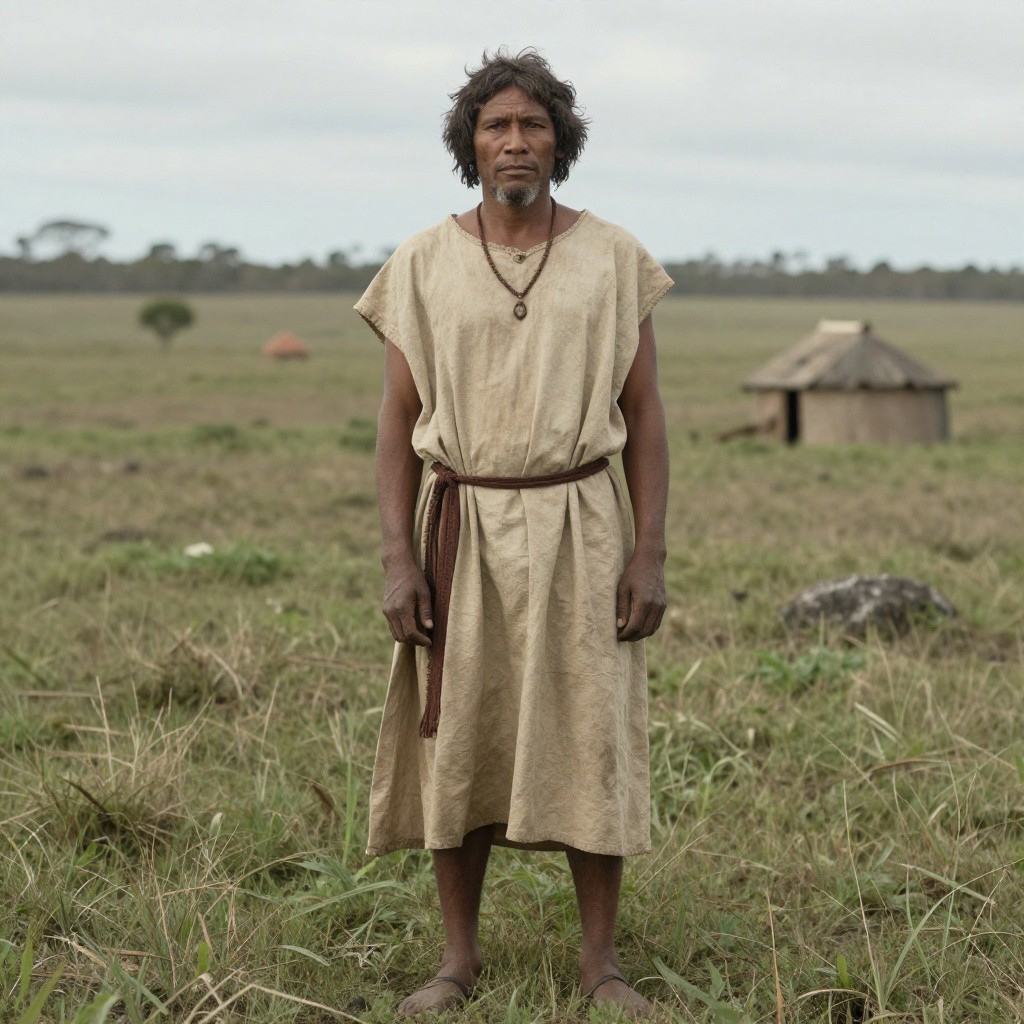
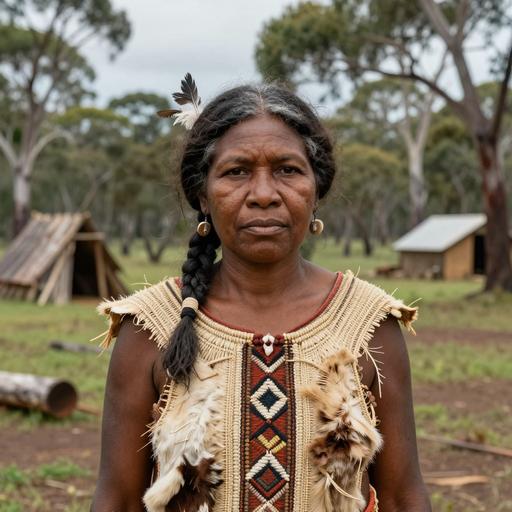
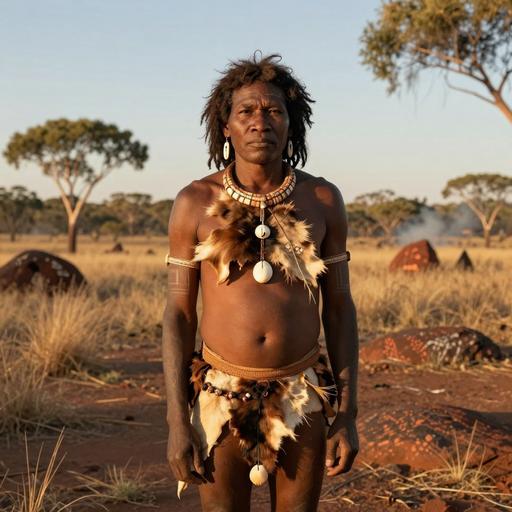
Portraits are AI-generated illustrations. Sample labels and accession IDs identify the reference records.

Portrait Sample Country Era Date Culture mtDNA Match
AI-generated illustrative portrait of Pre European individual, Willandra Lakes Region (New South Wales), Australia (400-1,800 CE)
Sample ID: WLH4
Australia Australia PreEuropean 400-1800 CE Australia_PreEuropean S2a1a Subclade
AI-generated illustrative portrait of Pre European individual, Barham Forest/Koondrook-Perricoota (New South Wales), Australia (400-500 CE)
Sample ID: KP2
Australia Aboriginal Australians of New South Wales 400-500 CE NSW Aboriginal S2a1a Subclade
AI-generated illustrative portrait of Aboriginal Australian individual, Willandra Lakes Region (New South Wales), Australia (410-1,788 CE)
Sample ID: WLH4_L3
Australia Aboriginal Australians of New South Wales 410 CE - 1788 CE NSW Aboriginal S2a1a Subclade
MATERNAL LINEAGE · ANCIENT DNA

Ancient lineage evidence map

Follow parent clades toward this branch and explore where ancient carriers were found.

Loading ancient observations…

Markers are archaeological find locations. A dashed connector is an uncertain, proposed geographic transition between consecutive branches supported by multiple dated observations; it is not an exact travel route, birthplace or proof of direct descent. Parent-clade samples may belong to other descendant branches. Gaps remain where evidence is insufficient. Sample dates differ from haplogroup formation dates.

Reference profile

Carrier Distribution Map

Geographic distribution of 3 ancient DNA samples (direct and subclade carriers of S2)

Subclade carrier
Time Period Filter
All Time Periods
Showing all samples
Reference profile

Temporal Distribution

Distribution of carriers across archaeological periods

Reference profile

Geographic Distribution

Counts by recorded sample country. These reflect the available reference selection, not population frequencies.

Reference profile

Country × Era Distribution

Compare recorded sample counts across countries and archaeological periods. Select a populated cell to inspect a sample.

Data

Data & Provenance

Source information and data quality

Last Updated 2026-02-16
Confidence Score 50/100
Coverage Low

Data Source

Classification, estimated dates and geographic context reflect the recorded reference data and may change as evidence is revised. Sample coverage is uneven; recorded locations and archaeological associations do not establish personal origin or cultural identity.

A haplogroup follows one maternal or paternal line. The branch prediction depends on which markers the DNA file contains. How our analysis works