mtDNA · Maternal lineage

G3A3

mtDNA Haplogroup G3A3

A reference profile for one lineage branch. Shared haplogroups do not establish a family relationship or cultural identity.

Reference profile

Branch background

Historical context for mtDNA lineage branch G3A3

Origins and Evolution

mtDNA haplogroup G3A3 is a downstream branch of G3A, itself a subclade of haplogroup G3. The parent clade G3A likely arose in Northeast/East Asia during the early Holocene (~9 kya) and shows continuity in northeastern Asian and Siberian hunter-gatherer populations. Based on its position in the phylogeny as a further split from G3A, G3A3 most plausibly originated later in the Holocene (mid-Holocene, roughly ~4–5 kya), representing a local diversification event within the broader G3 radiation. The timing and geographic pattern suggest G3A3 formed as regional populations in northeastern Asia experienced localized population growth, mobility, and lineage sorting during the later Holocene.

Subclades

As a named subclade (G3A3) of G3A, this lineage sits below G3A in the mtDNA tree. Depending on future full-mitogenome sequencing and phylogenetic resolution, G3A3 may be resolved into further sub-branches (e.g., G3A3a, G3A3b) where geographically structured variation is present. Presently, G3A3 is best understood as a geographically restricted branch that distinguishes a subset of maternal lineages within Northeast Asian G3 diversity.

Geographical Distribution

G3A3 is concentrated in northeastern East Asia and adjacent Siberian regions. Modern occurrences are most frequent in populations of the Russian Far East and northeastern Asia, with detectable presence in Japan (including Ainu and some Ryukyuan groups), Koreans and northeastern Han Chinese, and several indigenous Siberian groups. Its distribution indicates a core in the Amur–Okhotsk–Kamchatka region with extensions into neighboring Northeast Asian populations. Occurrences in Central Asia and the Americas, if present, are rare and typically represent low-frequency, localized finds likely due to later movements or recent gene flow.

Historical and Cultural Significance

The spatial pattern and estimated age of G3A3 point to a role in regional continuity among Holocene hunter-gatherer and later prehistoric communities in Northeast Asia. The lineage may be associated with late Neolithic to Bronze Age cultural horizons in the Amur and coastal Far East where local forager and mixed forager–farmer interactions occurred. In Japan, G3-derived lineages have been observed in Jomon-related remains and some modern indigenous groups (e.g., Ainu), so G3A3 may reflect either ancient Jomon-era continuity or later contacts across the sea—disentangling these scenarios requires dense ancient DNA sampling and mitogenome resolution.

Ancient DNA and Research Notes

Compared with the parent G3A clade (which appears in multiple ancient samples), G3A3 is rarer in published ancient datasets but has been identified in a small number of archaeological contexts and in several contemporary northeastern Asian populations. Full mitogenome sequencing and broader geographic sampling (particularly of ancient remains from the Amur, Okhotsk, and Hokkaido regions) will clarify the subclade's precise origin date, phylogeographic structure, and demographic history.

Conclusion

G3A3 is a mid-Holocene, Northeast/East Asian maternal lineage that represents local branching within the broader G3A radiation. Its contemporary distribution—centered on the Russian Far East, northeastern Asia, and parts of Japan—highlights regional continuity and localized expansions in the Holocene. Further mitogenomic and ancient DNA work will refine its substructure, age estimates, and archaeological associations.

Key Points

  • Origins and Evolution
  • Subclades
  • Geographical Distribution
  • Historical and Cultural Significance
  • Ancient DNA and Research Notes

Reference profile

Tree & Relationships

Phylogenetic context and subclades

Evolution Path

Follow the recorded parent branches toward G3A3. Dates are estimates and can change as reference data is revised.

Steps Haplogroup Age Estimate Archaeology Era Time Passed Immediate Descendants Tested Modern Descendants Ancient Connections
1 G3A3 Current ~4,000 years ago Bronze Age 4,500 years 0 2 0
2 G3A ~9,000 years ago Neolithic 9,000 years 2 4 11
3 G3 ~12,000 years ago Neolithic 12,000 years 2 10 1
4 G ~35,000 years ago Paleolithic 35,000 years 4 382 3
5 M12'G - - - 2 383 0
6 M ~60,000 years ago Paleolithic 60,000 years 42 2,671 41
7 L3 ~70,000 years ago Paleolithic 70,000 years 7 30,162 6
8 L3'4 - - - 2 30,212 0
9 L3'4'6 - - - 2 30,216 0
10 L2'3'4'6 - - - 2 31,333 0
11 L2'3'4'5'6'7 - - - 2 31,349 0
12 L1'2'3'4'5'6'7 - - - 2 31,852 0
13 L ~160,000 years ago Paleolithic 160,000 years 2 32,236 5

Subclades (0)

Terminal branch - no recorded subclades

Siblings (1)

Other branches from the same parent haplogroup

Reference profile

Where in the World

Geographic distribution and modern presence

Recorded origin

Northeast / East Asia

Modern Distribution

The populations where mtDNA haplogroup G3A3 is found include:

  1. Japanese populations (including Ainu and some Ryukyuan groups)
  2. Koreans and northeastern Han Chinese
  3. Indigenous Siberian groups (e.g., Yakut, Evenk, Koryak, Nganasan)
  4. Populations of the Russian Far East (e.g., Kamchatka, Amur region)
  5. Mongolic groups in northeastern Mongolia and Buryatia (low to moderate frequencies)
  6. Occasional/rare occurrences reported in northern Circumpolar communities and isolated finds in the Americas (generally very low frequency)
Historical context

A branch through time

Estimated formation in a broad historical timeline. Period markers provide context and do not imply a connection with particular cultures.

  1. ~10k years ago

    Neolithic Revolution

    Agriculture begins, settled communities form

  2. ~5k years ago

    Bronze Age

    Metalworking, writing, and early civilizations

  3. ~4.5k years ago

    Haplogroup G3A3

    Estimated formation of this mtDNA branch; dates and locations are reference estimates.

    This branch
  4. ~3k years ago

    Iron Age

    Iron tools, expanded trade networks

  5. ~2.5k years ago

    Classical Antiquity

    Greek and Roman civilizations flourish

  6. Present

    Present Day

    Modern era

Reference profile

Archaeological context

Recorded archaeological associations for mtDNA branch G3A3

Recorded associations

These labels describe archaeological contexts recorded for reference samples linked to G3A3. An association does not establish that all carriers belonged to a culture or followed a particular migration route.

Austria_Avar Avar Culture Brailita Early Medieval Mongolian Khovsgol Culture Russia_Samara_Khazar Umungobi Medieval Upper Yellow River Culture Wuzan Culture Xiongnu Culture
Culture assignments are based on archaeological context of ancient DNA samples and may represent regional associations during specific time periods.
Reference profile

Sample Catalog

11 direct carriers of haplogroup G3A3

10 shown · 11 matching samples

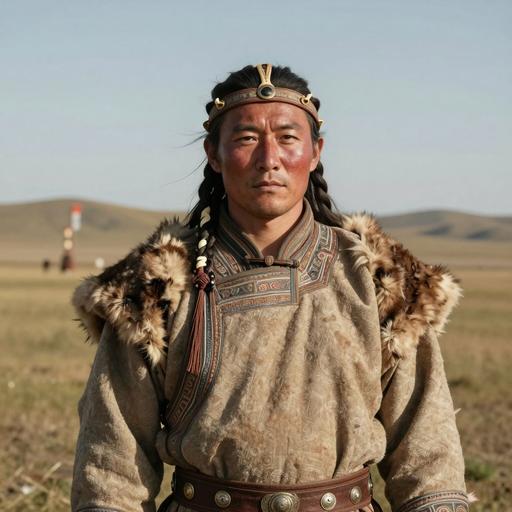
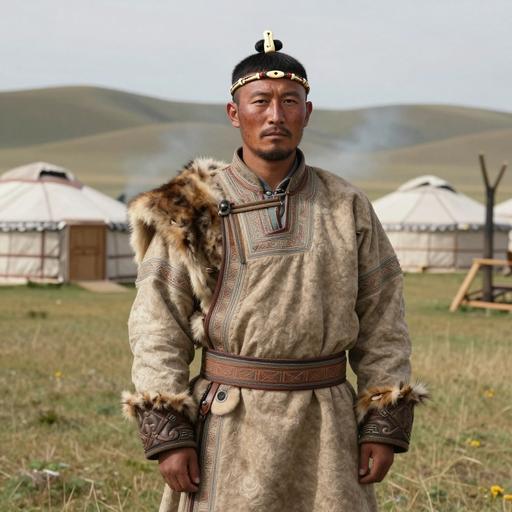
Portraits are AI-generated illustrations. Sample labels and accession IDs identify the reference records.

Portrait Sample Country Era Date Culture mtDNA Match
AI-generated illustrative portrait of Nomadic Steppe Cultures individual, Siberia. Tungus & Eastern Steppe, Mongolia (351-54 BCE)
Sample ID: DA41
Mongolia Xiongnu Period Mongolia 351 BCE - 54 BCE Xiongnu Culture G3a3 Direct
AI-generated illustrative portrait of Xiongnu individual, Siberia. Tungus & Eastern Steppe, Mongolia (351-54 BCE)
Sample ID: DA41
Mongolia The Xiongnu Empire 351 BCE - 54 BCE G3a3 Direct
AI-generated illustrative portrait of Avar individual, Leobersdorf (Lower Austria, Baden District), Austria (650-800 CE)
Sample ID: LEO004
Austria Austria Avar 650-800 CE Austria_Avar G3a3 Direct
AI-generated illustrative portrait of Avar individual, Leobersdorf (Lower Austria, Baden District), Austria (650-800 CE)
Sample ID: LEO019
Austria Austria Avar 650-800 CE Austria_Avar G3a3 Direct
AI-generated illustrative portrait of Avar individual, Leobersdorf (Lower Austria, Baden District), Austria (650-800 CE)
Sample ID: LEO067
Austria Austria Avar 650-800 CE Austria_Avar G3a3 Direct
AI-generated illustrative portrait of Late Avar-o High East Asia individual, Hajdú-Bihar County. Árkus-Homokbánya, Hungary (662-776 CE)
Sample ID: ARK-36
Hungary Hungary LateAvar 662-776 calCE (1286±27 BP, DeA-22530) Avar Culture G3a3 Direct
AI-generated illustrative portrait of Samara Khazar individual, Brusyany (Samara Oblast, Stavropolsky District, Brusyany Village), Russia (700-900 CE)
Sample ID: I19086
Russia Russia Samara Khazar 700-900 CE Russia_Samara_Khazar G3a3 Direct
AI-generated illustrative portrait of Arkhangai Early Medieval individual, Arkhangai. Olon Dov, Mongolia (700-1,050 CE)
Sample ID: OLN010
Mongolia Mongolia Arkhangai EarlyMedieval 700-1050 CE Early Medieval Mongolian G3a3 Direct
AI-generated illustrative portrait of Xinjiang Wuzan IA-o East Asia individual, Xinjiang. Yili Region. Nileke County. Wuzan, China (750-350 BCE)
Sample ID: C845
China China Xinjiang Wuzan IA 750-350 BCE Wuzan Culture G3a3 Direct
AI-generated illustrative portrait of Late Avar-o Low East Asia individual, Hajdú-Bihar County. Árkus-Homokbánya, Hungary (772-977 CE)
Sample ID: ARK-21
Hungary Hungary LateAvar 772-977 calCE (1160±27 BP, DeA-22533) Avar Culture G3a3 Direct
MATERNAL LINEAGE · ANCIENT DNA

Ancient lineage evidence map

Follow parent clades toward this branch and explore where ancient carriers were found.

Loading ancient observations…

Markers are archaeological find locations. A dashed connector is an uncertain, proposed geographic transition between consecutive branches supported by multiple dated observations; it is not an exact travel route, birthplace or proof of direct descent. Parent-clade samples may belong to other descendant branches. Gaps remain where evidence is insufficient. Sample dates differ from haplogroup formation dates.

Reference profile

Carrier Distribution Map

Geographic distribution of 11 ancient DNA samples (direct and subclade carriers of G3A3)

Direct carrier
Time Period Filter
All Time Periods
Showing all samples
Reference profile

Temporal Distribution

Distribution of carriers across archaeological periods

Reference profile

Geographic Distribution

Counts by recorded sample country. These reflect the available reference selection, not population frequencies.

Reference profile

Country × Era Distribution

Compare recorded sample counts across countries and archaeological periods. Select a populated cell to inspect a sample.

Data

Data & Provenance

Source information and data quality

Last Updated 2026-02-16
Confidence Score 50/100
Coverage Low

Data Source

Classification, estimated dates and geographic context reflect the recorded reference data and may change as evidence is revised. Sample coverage is uneven; recorded locations and archaeological associations do not establish personal origin or cultural identity.

A haplogroup follows one maternal or paternal line. The branch prediction depends on which markers the DNA file contains. How our analysis works