A reference profile for one lineage branch. Shared haplogroups do not establish a family relationship or cultural identity.
Reference profile
Branch background
Historical context for mtDNA lineage branch R1B1
Origins and Evolution
mtDNA haplogroup R1B1 is a subclade of mtDNA haplogroup R1, itself a branch of the widespread macro-haplogroup R. Based on its phylogenetic position and coalescence estimates for related R1 lineages, R1B1 most likely diversified in the South Asian subcontinent during the Late Pleistocene to early Holocene (a reasonable estimate for the split of this subclade is on the order of ~15 kya). Its emergence reflects regional maternal diversification after the initial spread of macro-haplogroup R out of Southwest and South Asia. The clade shows derived mutations that distinguish it from sister clades within R1 and is part of the mosaic of lineages that characterize deep maternal structure in South Asia.
Subclades
R1B1 contains internal variation at the sequence level (private mutations and downstream branches) that are increasingly being resolved as more high-coverage mitochondrial genomes from South Asia are generated. Some sampled lineages fall into well-defined minor subbranches, while others remain categorized as basal R1B1 due to limited sampling. Compared with continental macro-haplogroups (e.g., M or U), the internal topology of R1B1 is relatively shallow in published trees but shows geographically localized differentiation consistent with long-term regional presence.
Geographical Distribution
The highest frequencies and diversity of R1B1 are found within the Indian subcontinent, where it appears in a broad range of caste and tribal groups. Lower-frequency occurrences extend into Pakistan (particularly Punjab and Sindh), Sri Lanka, and sporadically into Central Asia, Southeast Asia (e.g., Myanmar, Thailand) and East Asia, where detections are rare. The observed pattern—high diversity in South Asia with scattered low-frequency occurrences beyond—supports an origin in South Asia with later limited dispersals or gene flow events leading to its presence outside the core region. In ancient DNA datasets, R1B1 has been identified in multiple archaeological samples (46 occurrences in the user database), indicating persistence through Holocene periods in the region.
Historical and Cultural Significance
Because R1B1 likely predates major Holocene cultural horizons in South Asia, it is most informative about pre-Neolithic and early Holocene maternal population structure. Its presence across diverse modern South Asian groups suggests long-term regional continuity and local differentiation rather than association with a single recent demographic replacement. Where R1B1 appears in archaeological contexts, it can help trace maternal lineages across transitions such as the Mesolithic-to-Neolithic and later Bronze Age cultural expansions. While not diagnostic of any single archaeological culture, R1B1 contributes to the maternal backdrop against which cultures like the Indus Valley Civilization developed.
Conclusion
mtDNA haplogroup R1B1 is a South Asia-centered maternal lineage that represents a regional branch of macro-haplogroup R. Its distribution—high diversity and frequency in the Indian subcontinent with sporadic low-frequency occurrences elsewhere—points to a Late Pleistocene/early Holocene origin in South Asia followed by local diversification and limited outward gene flow. Continued mitogenome sequencing and ancient DNA sampling across South and neighboring regions will refine the internal structure, time depth, and migratory episodes associated with R1B1.
Key Points
Origins and Evolution
Subclades
Geographical Distribution
Historical and Cultural Significance
Conclusion
Reference profile
Tree & Relationships
Phylogenetic context and subclades
Evolution Path
Follow the recorded parent branches toward R1B1. Dates are estimates and can change as reference data is revised.
The populations where MTDNA haplogroup R1B1 is found include:
Various populations across India (including tribal and caste groups)
Pakistani populations (e.g., Punjab, Sindh)
Sri Lankan populations (at lower frequencies)
Central Asian groups (sporadic occurrences)
Southeast Asian populations (low frequencies; e.g., Myanmar, Thailand)
East Asian populations (rare/low frequency detections)
Historical context
A branch through time
Estimated formation in a broad historical timeline. Period markers provide context and do not imply a connection with particular cultures.
~20k years ago
Last Glacial Maximum
Peak of the last ice age, populations isolated
~15k years ago
Haplogroup R1B1
Estimated formation of this mtDNA branch; dates and locations are reference estimates.
This branch
~10k years ago
Neolithic Revolution
Agriculture begins, settled communities form
~5k years ago
Bronze Age
Metalworking, writing, and early civilizations
~3k years ago
Iron Age
Iron tools, expanded trade networks
~2.5k years ago
Classical Antiquity
Greek and Roman civilizations flourish
Present
Present Day
Modern era
Reference profile
Archaeological context
Recorded archaeological associations for mtDNA branch R1B1
Recorded associations
These labels describe archaeological contexts recorded for reference samples linked to R1B1. An association does not establish that all carriers belonged to a culture or followed a particular migration route.
ErtebølleKörös CultureKoshkino-BoborykinoLate Medieval NordicLengyel CultureOb River CultureRussia_AltaiKrai_NRussia_KemerovoOblastKuzbass_NRussia_Omsk_Eneolithic_ChernoozerskyRussia_Saratov_Eneolithic_Khvalynsk
Culture assignments are based on archaeological context of ancient DNA samples and may represent regional associations during specific time periods.
Reference profile
Sample Catalog
52 direct carriers and 1 subclade carrier of haplogroup R1B1
10 shown · 50 matching samples
No samples match these filters. Try another label, location or period.
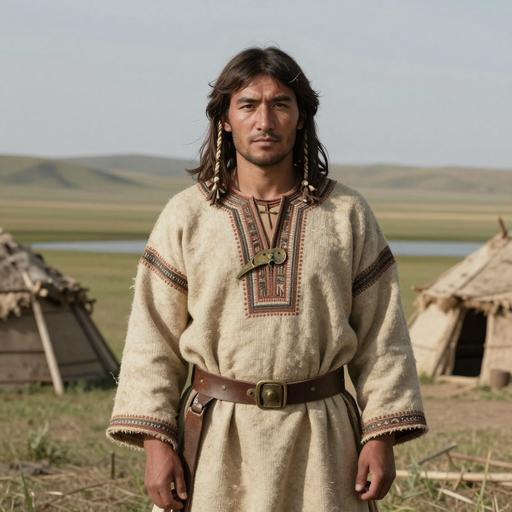
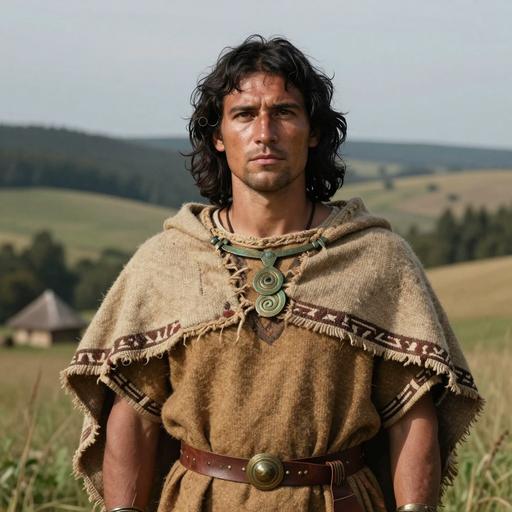
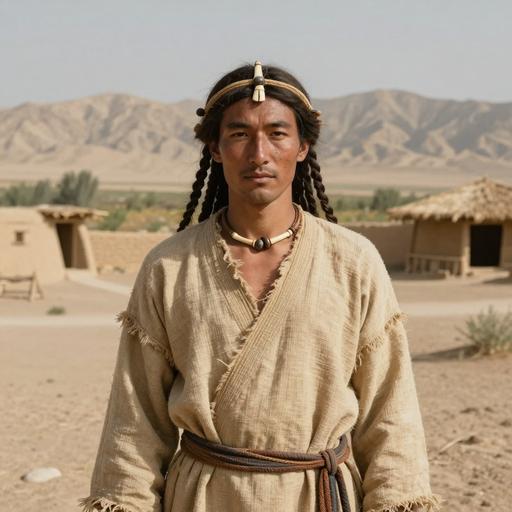
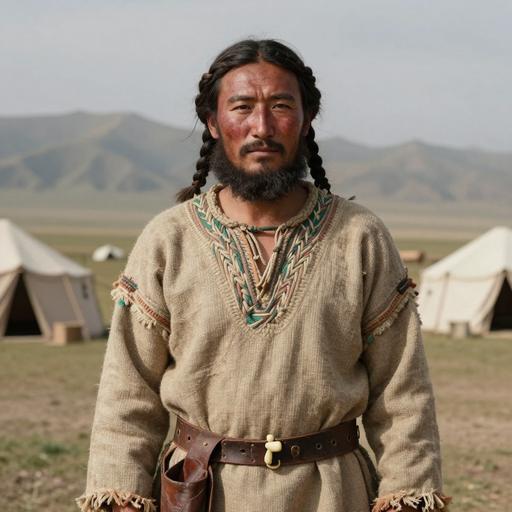
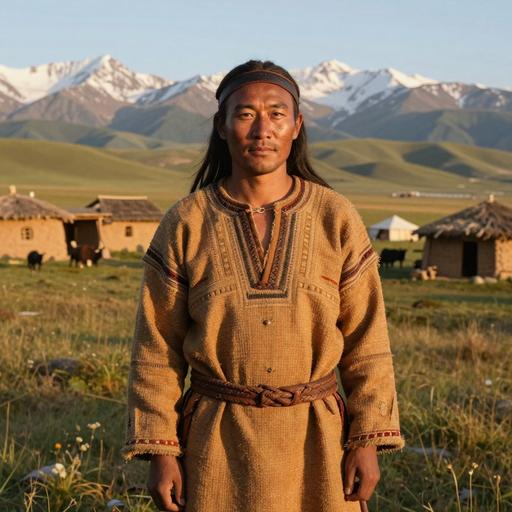
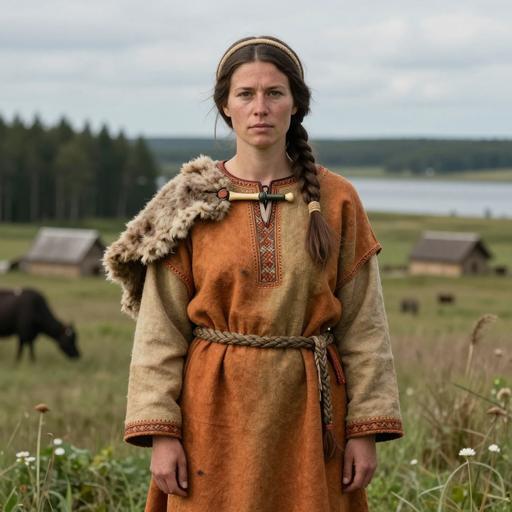
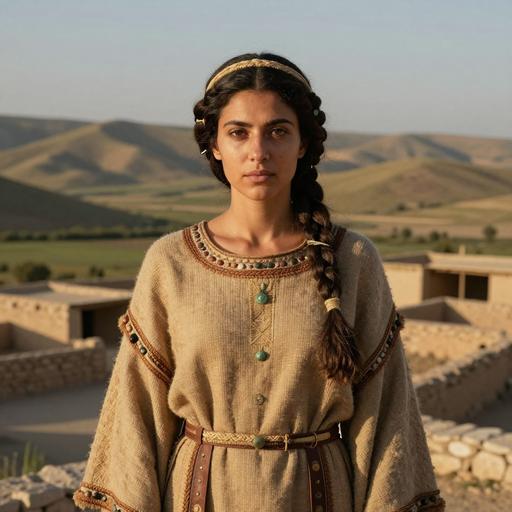
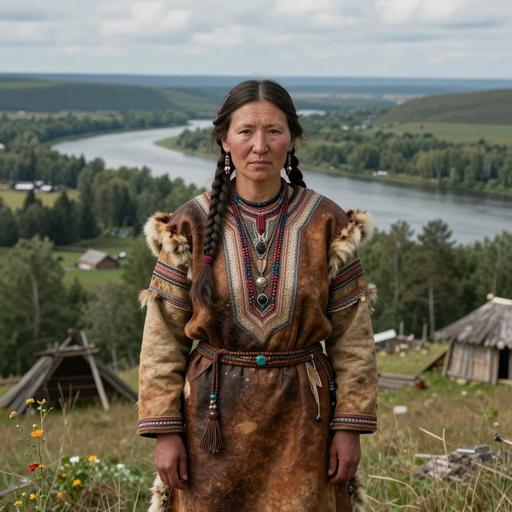
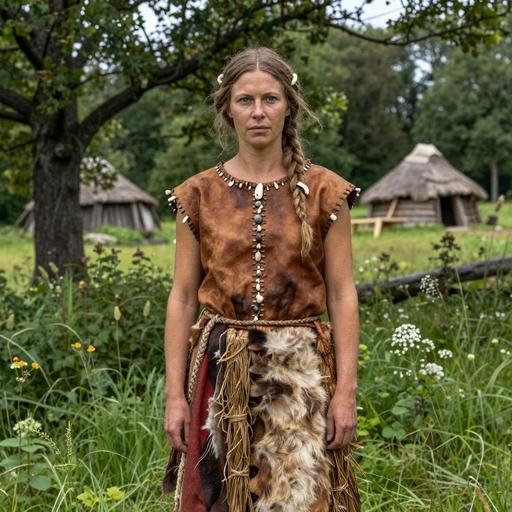
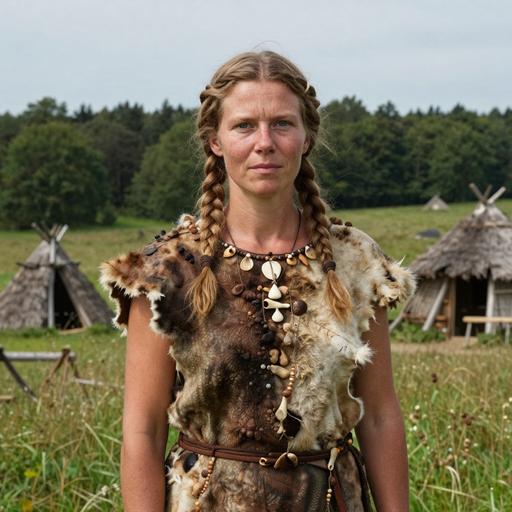
Portraits are AI-generated illustrations. Sample labels and accession IDs identify the reference records.
Follow parent clades toward this branch and explore where ancient carriers were found.
Loading ancient observations…
Reduced motion is enabled. Use the timeline or Show all to explore at your own pace.
Read observations as a table
Displayed ancient observations by branch, period and date midpoint
Branch
Period
Date range
Sample
Sample ID
Location
Haplogroup
Relationship
Markers are archaeological find locations. A dashed connector is an uncertain, proposed geographic transition between consecutive branches supported by multiple dated observations; it is not an exact travel route, birthplace or proof of direct descent. Parent-clade samples may belong to other descendant branches. Gaps remain where evidence is insufficient. Sample dates differ from haplogroup formation dates.
Grouping by historical period reflects when each ancient individual lived, combined across every branch on this lineage chain; it is not a migration sequence or a personal timeline between periods.
Reference profile
Carrier Distribution Map
Geographic distribution of 53 ancient DNA samples (direct and subclade carriers of R1B1)
Direct carrier Subclade carrier
Time Period Filter
All Time Periods
Showing all samples
Reference profile
Temporal Distribution
Distribution of carriers across archaeological periods
Reference profile
Geographic Distribution
Counts by recorded sample country. These reflect the available reference selection, not population frequencies.
Reference profile
Country × Era Distribution
Compare recorded sample counts across countries and archaeological periods. Select a populated cell to inspect a sample.
Data
Data & Provenance
Source information and data quality
Last Updated2026-02-16
Confidence Score50/100
CoverageLow
Data Source
Classification, estimated dates and geographic context reflect the recorded reference data and may change as evidence is revised. Sample coverage is uneven; recorded locations and archaeological associations do not establish personal origin or cultural identity.