mtDNA · Maternal lineage

T1A1

mtDNA Haplogroup T1A1

A reference profile for one lineage branch. Shared haplogroups do not establish a family relationship or cultural identity.

Reference profile

Branch background

Historical context for mtDNA lineage branch T1A1

Origins and Evolution

T1A1 is a subclade of mtDNA haplogroup T1A, which itself derives from haplogroup T1. The parent clade T1A has been associated with early Neolithic expansions out of the Near East; T1A1 most likely arose after the initial T1A diversification, plausibly in the Near East or adjacent regions during the later part of the early Neolithic (several thousand years after the initial farmer dispersals). Its time depth is therefore expected to be younger than the estimated ~9 kya origin of T1A and is consistent with a mid- to late-Neolithic age for a daughter lineage.

Mitochondrial lineages like T1A1 spread primarily through female-mediated demographic processes — migration of farming communities, local admixture with hunter-gatherers, and later historical population movements (trade, imperial expansions, diaspora communities). Ancient DNA recoveries and modern population surveys place T1A1 within that broader Near Eastern–Mediterranean maternal genetic landscape.

Subclades (if applicable)

T1A1 may contain further internal branches identifiable by specific control-region and coding-region mutations in full mitogenome analyses. Some published mitogenomes and aDNA samples show micro-structure within T1A1 reflecting local founder events and drift (for example, island or coastal populations showing private lineages). High-resolution phylogenies based on whole mitogenomes are needed to resolve named downstream subclades clearly; such work often reveals geographically restricted sub-branches tied to regional demographic histories.

Geographical Distribution

T1A1 is most frequent in regions historically connected to Neolithic and post-Neolithic movement from the Near East. The haplogroup occurs at moderate frequencies in parts of the Near East and Southern Europe, with lower but measurable frequencies along the Mediterranean coast of North Africa and sporadic occurrences in Eastern Europe and Central Asia. Modern and ancient DNA datasets together indicate the lineage has a strong Mediterranean/Levantine signal, reflecting transmission via maritime and overland Neolithic farmer networks and later historical population flows (including trade and religious diasporas).

Historical and Cultural Significance

Because T1A1 derives from a Neolithic-rooted clade, its historical significance is tied to the spread of agriculture and associated demographic shifts. The presence of T1A1 in archaeological and modern contexts in southern Europe and the Levant is consistent with female-line ancestry within farming communities, coastal exchanges in the Mediterranean, and later connectivity such as Phoenician, Greek, Roman, Byzantine, and medieval networks.

T1A1 is also observed among some Jewish maternal lineages (notably in some Ashkenazi and other Jewish collections), reflecting complex historical migrations and founder events in diasporic communities. In many cases the lineage's presence in Jewish or coastal Mediterranean populations represents layering of Neolithic substrate with later cultural-specific demographic events.

Conclusion
T1A1 is a Neolithic-descended maternal lineage that illustrates how maternal genetic diversity of the Near East was exported into Europe, North Africa, and parts of Asia with early farmers and maintained through subsequent historical processes. Its identification in both ancient and modern mitogenomes makes T1A1 a useful marker for tracing maternal connections between the Near East and Mediterranean Europe and for studying localized founder effects in particular populations.

Key Points

  • Origins and Evolution
  • Subclades (if applicable)
  • Geographical Distribution
  • Historical and Cultural Significance
  • Conclusion

Reference profile

Tree & Relationships

Phylogenetic context and subclades

Evolution Path

Follow the recorded parent branches toward T1A1. Dates are estimates and can change as reference data is revised.

Steps Haplogroup Age Estimate Archaeology Era Time Passed Immediate Descendants Tested Modern Descendants Ancient Connections
1 T1A1 Current ~7,000 years ago Neolithic 7,000 years 10 207 0
2 T1A ~9,000 years ago Neolithic 9,000 years 8 243 175
3 T1 ~10,000 years ago Neolithic 10,000 years 3 245 28
4 T ~27,000 years ago Paleolithic 27,000 years 3 1,950 84
5 JT ~40,000 years ago Paleolithic 40,000 years 2 4,094 1
6 R2'JT - - - 2 4,133 0
7 R ~55,000 years ago Paleolithic 55,000 years 17 22,830 57
8 NA - - - 1 22,830 0
9 N ~60,000 years ago Paleolithic 60,000 years 16 26,150 13
10 L3 ~70,000 years ago Paleolithic 70,000 years 7 30,162 6
11 L3'4 - - - 2 30,212 0
12 L3'4'6 - - - 2 30,216 0
13 L2'3'4'6 - - - 2 31,333 0
14 L2'3'4'5'6'7 - - - 2 31,349 0
15 L1'2'3'4'5'6'7 - - - 2 31,852 0
16 L ~160,000 years ago Paleolithic 160,000 years 2 32,236 5

Siblings (7)

Other branches from the same parent haplogroup

Reference profile

Where in the World

Geographic distribution and modern presence

Recorded origin

Near East

Modern Distribution

The populations where mtDNA haplogroup T1A1 is found include:

  1. Middle Eastern populations
  2. North African populations (Mediterranean coast)
  3. Southern European populations (Italy, Greece, Iberia)
  4. Eastern European populations (Balkans, parts of the Black Sea region)
  5. Central Asian populations (sporadic occurrence)
  6. Jewish populations, notably some Ashkenazi maternal lineages
Historical context

A branch through time

Estimated formation in a broad historical timeline. Period markers provide context and do not imply a connection with particular cultures.

  1. ~10k years ago

    Neolithic Revolution

    Agriculture begins, settled communities form

  2. ~7k years ago

    Haplogroup T1A1

    Estimated formation of this mtDNA branch; dates and locations are reference estimates.

    This branch
  3. ~5k years ago

    Bronze Age

    Metalworking, writing, and early civilizations

  4. ~3k years ago

    Iron Age

    Iron tools, expanded trade networks

  5. ~2.5k years ago

    Classical Antiquity

    Greek and Roman civilizations flourish

  6. Present

    Present Day

    Modern era

Reference profile

Archaeological context

Recorded archaeological associations for mtDNA branch T1A1

Recorded associations

These labels describe archaeological contexts recorded for reference samples linked to T1A1. An association does not establish that all carriers belonged to a culture or followed a particular migration route.

Afanasievo Chemurchek Culture Corded Ware Russia_Chelyabinsk_EBA_Yamnaya Russia_MBA_Caucasus Russia_Orenburg_EBA_Yamnaya Russia_Rostov_EBA_Yamnaya Russia_Rostov_EBA_Yamnaya-o Slovakia_EBA_Yamnaya Yamnaya Culture
Culture assignments are based on archaeological context of ancient DNA samples and may represent regional associations during specific time periods.
Reference profile

Sample Catalog

68 direct carriers and 32 subclade carriers of haplogroup T1A1

10 shown · 50 matching samples

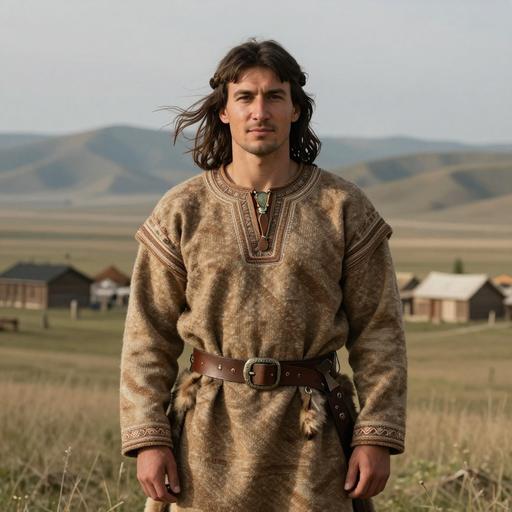
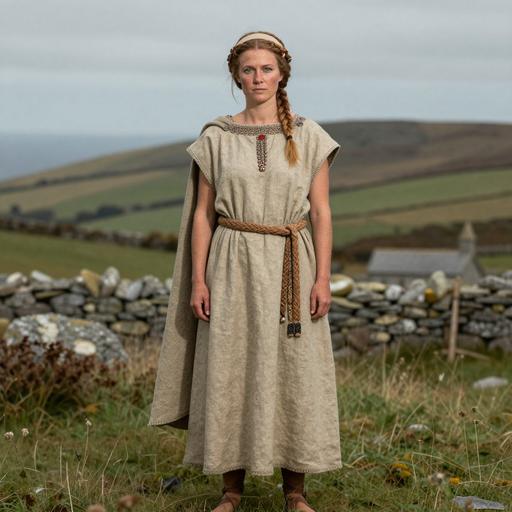
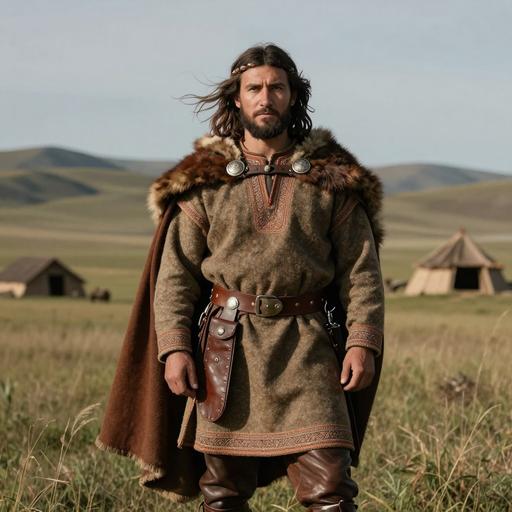
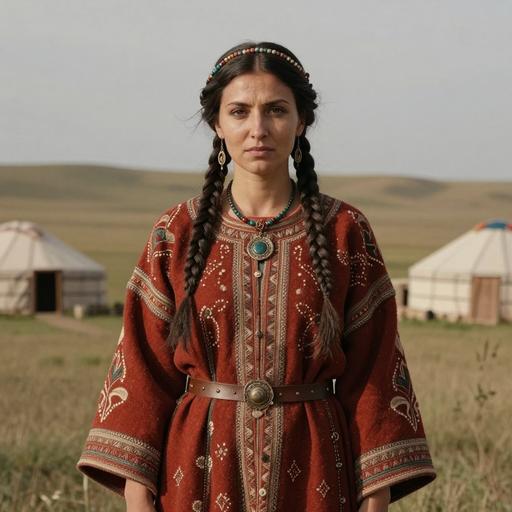
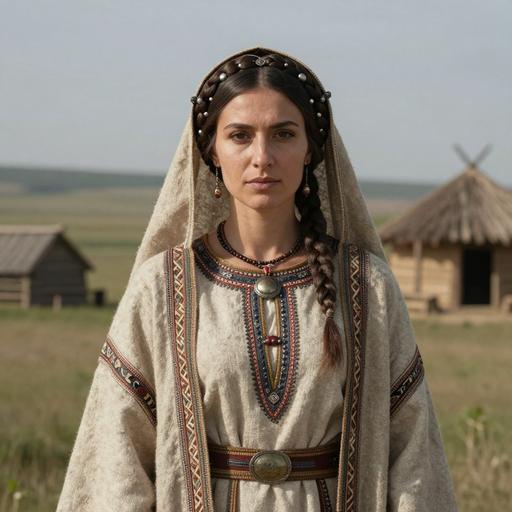
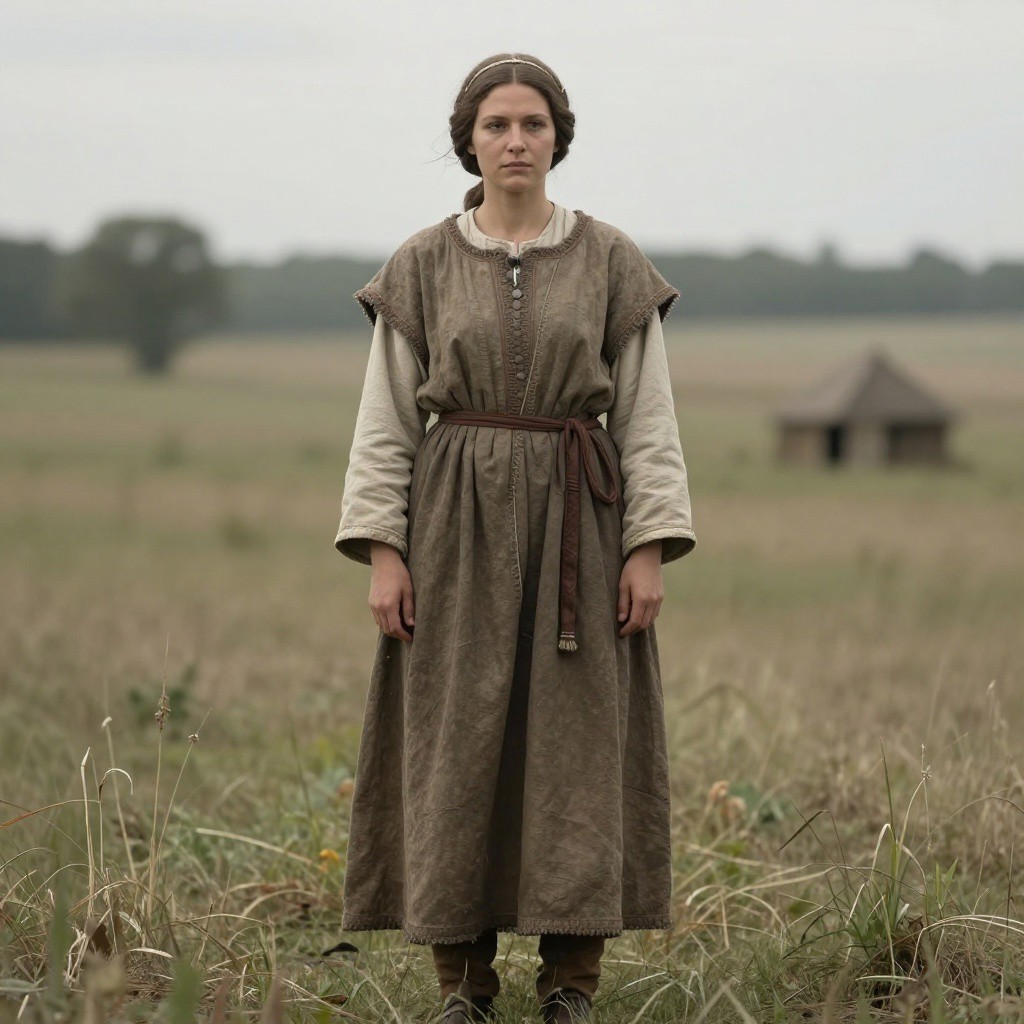
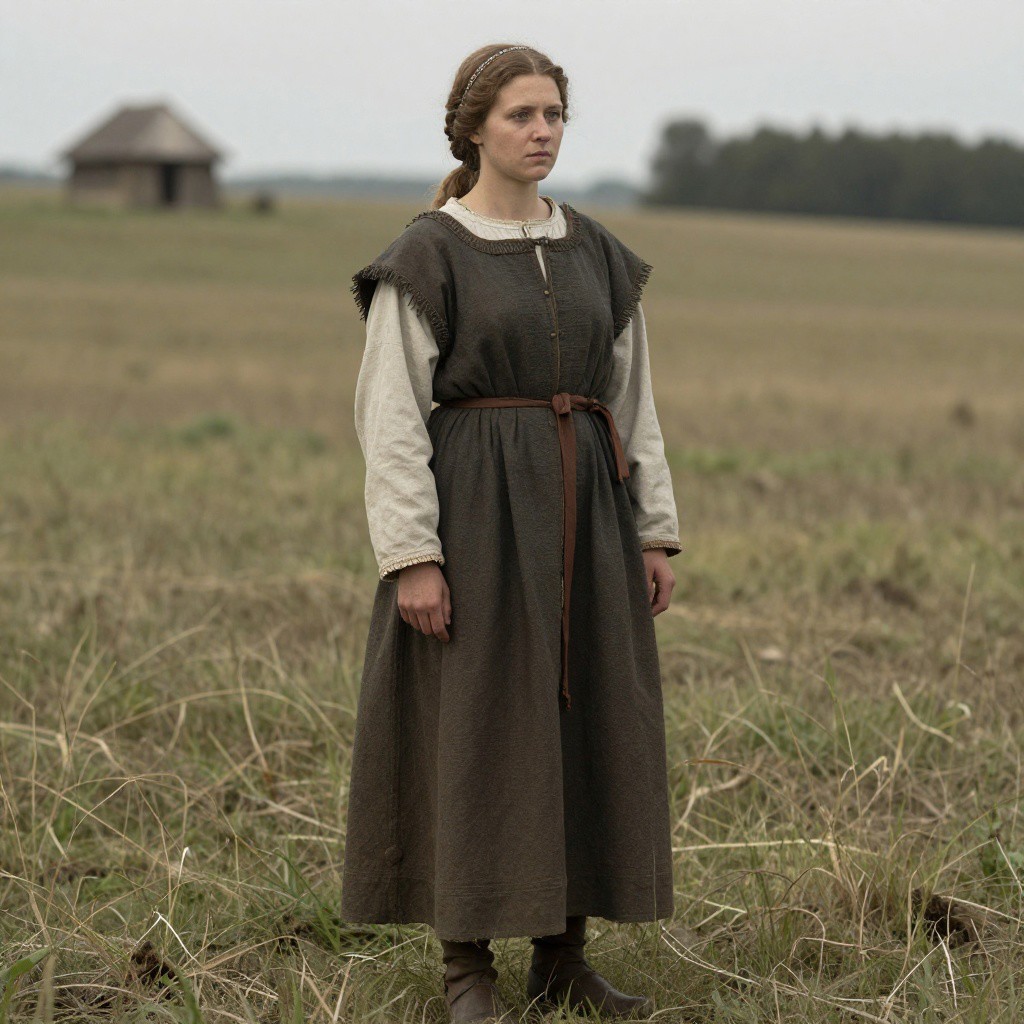
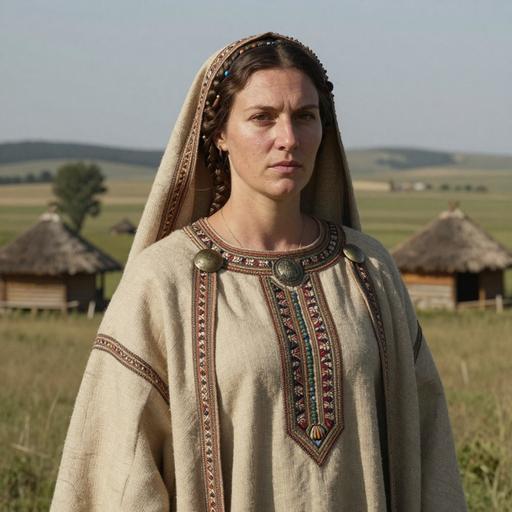
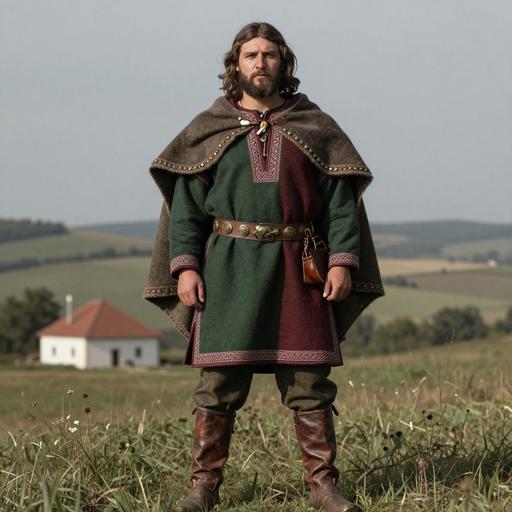
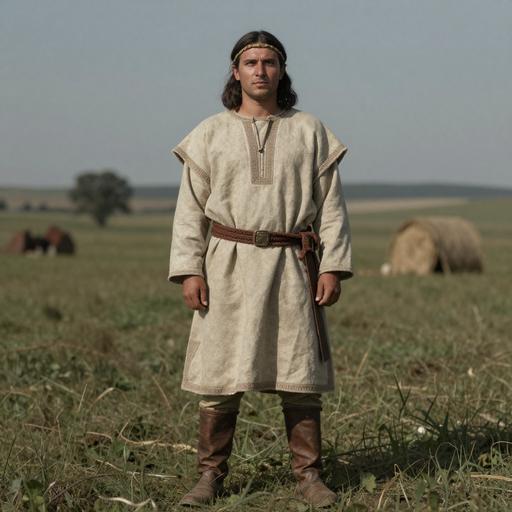
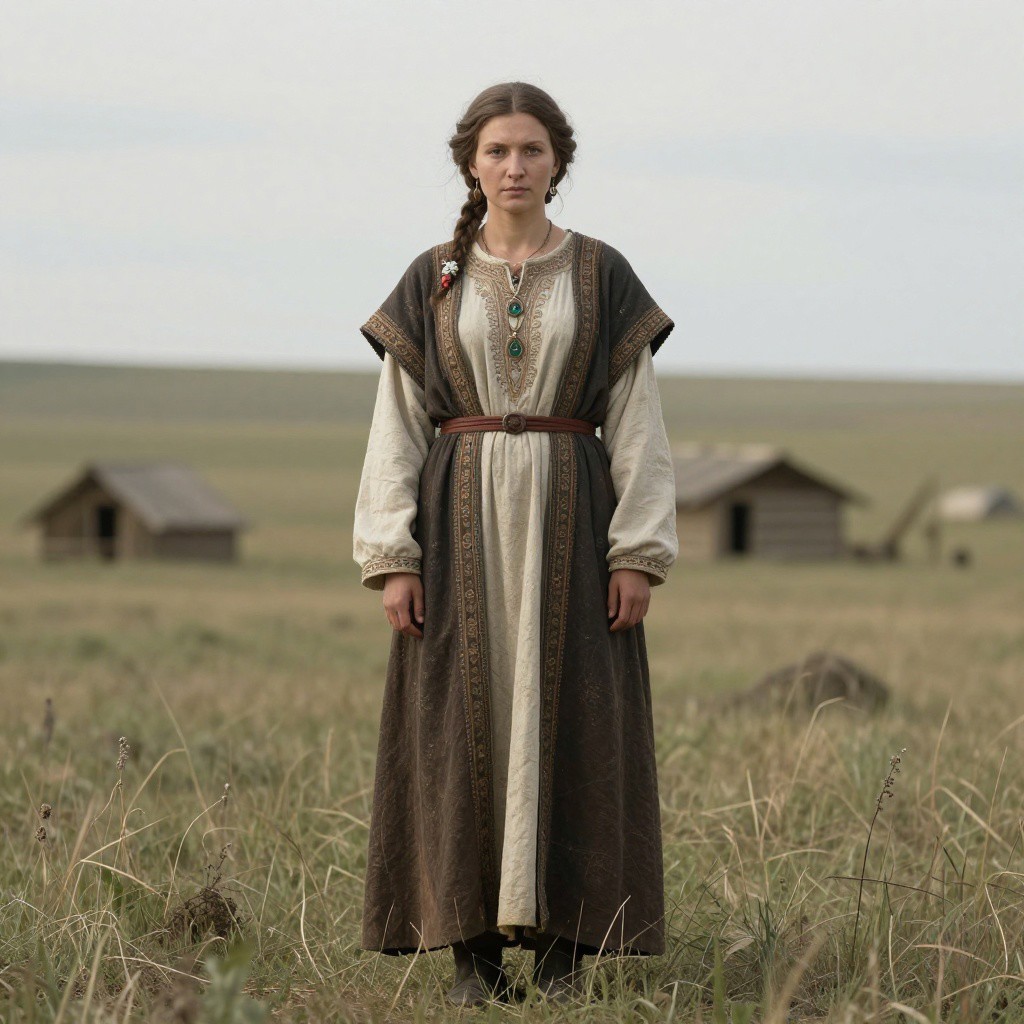
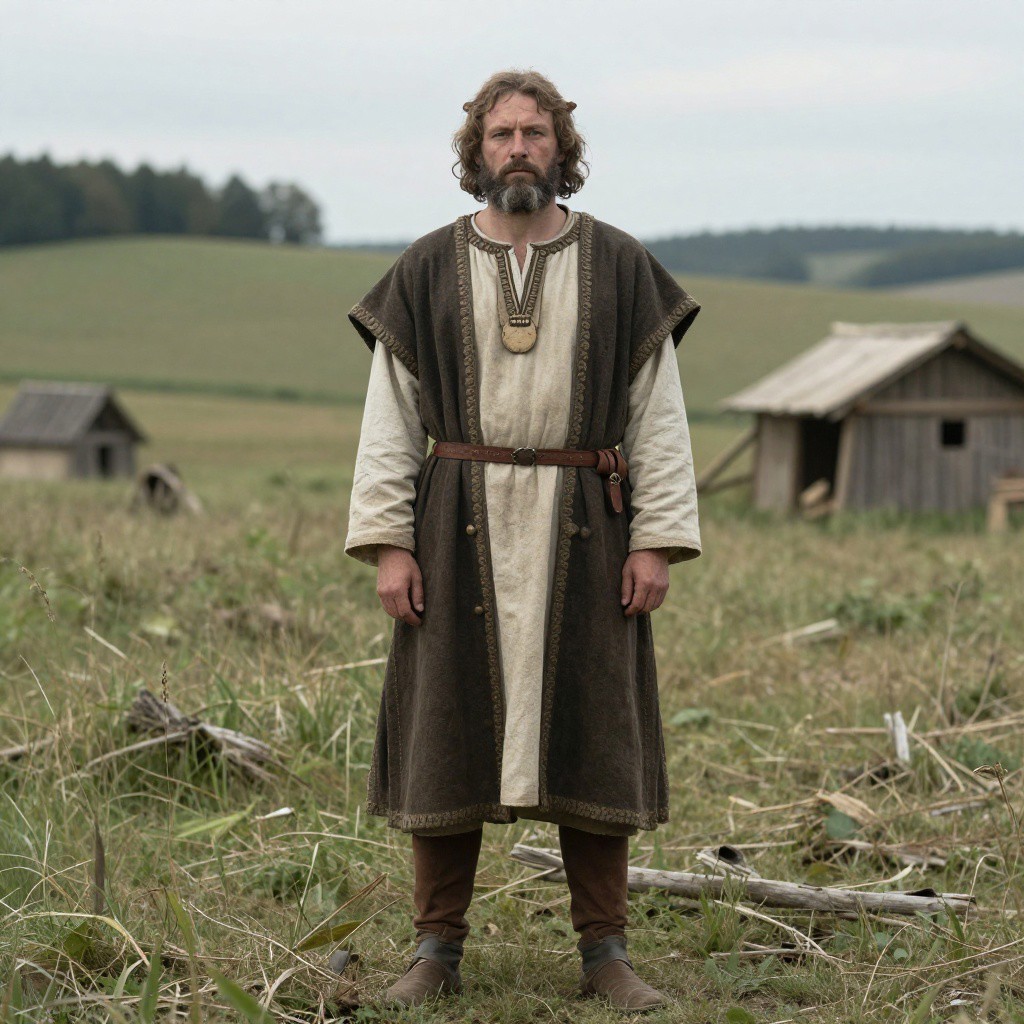
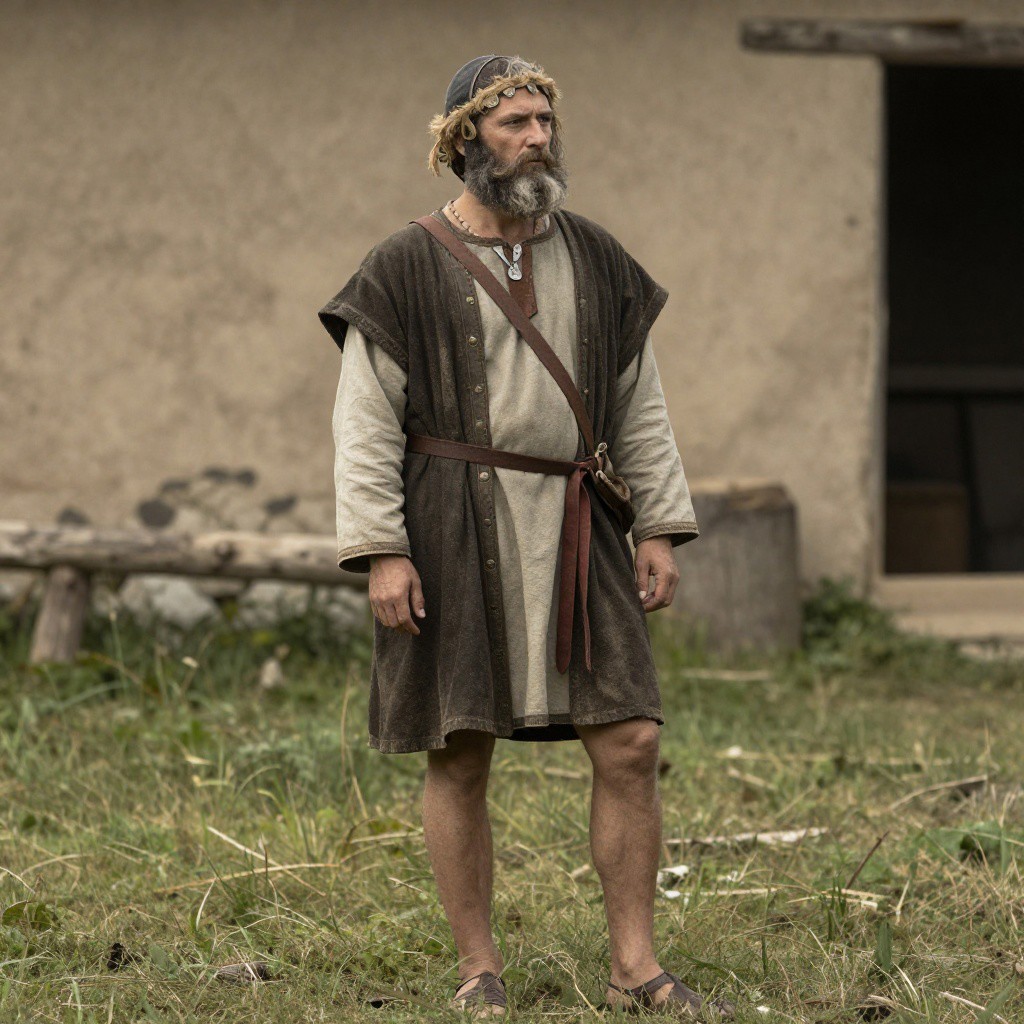
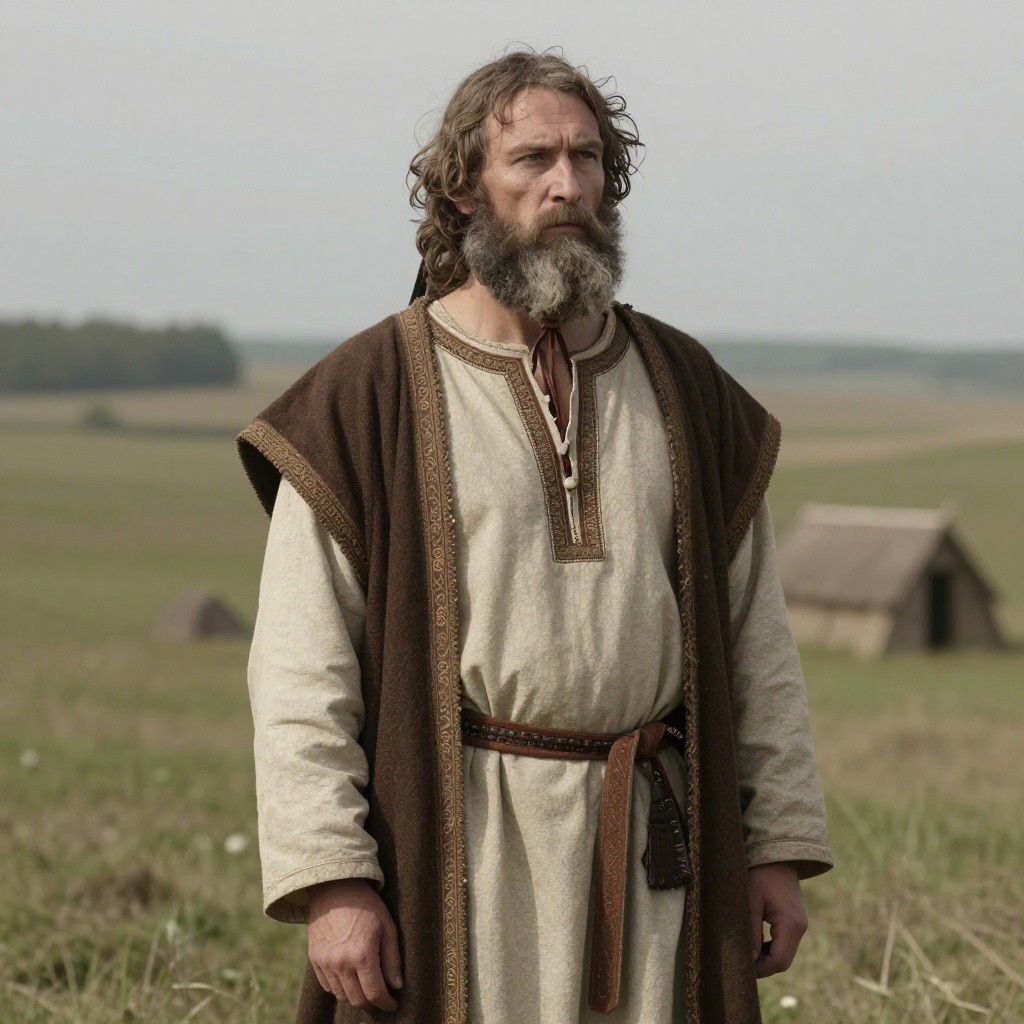
Portraits are AI-generated illustrations. Sample labels and accession IDs identify the reference records.
Portrait Sample Country Era Date Culture mtDNA Match
AI-generated illustrative portrait of Eurasian Nomadic individual, Orenburg Regio. Southern Urals. Cherniy Yar, Russia (81-236 CE)
Sample ID: chy002
Russia Russia LateSarmatian 81 CE - 236 CE Sarmatian Culture T1a1 Direct
AI-generated illustrative portrait of Sarmatian individual, Orenburg Regio. Southern Urals. Cherniy Yar, Russia (81-236 CE)
Sample ID: chy002
Russia The Sarmatian Culture 81 CE - 236 CE T1a1 Direct
AI-generated illustrative portrait of Antiquity individual, Surxondaryo Region, Rabat, Uzbekistan (150 BCE-50 CE)
Sample ID: L8622
Uzbekistan Iron Age Rabat Culture of Surxondaryo 150 BCE - 50 CE Rabat Culture T1a1 Direct
AI-generated illustrative portrait of England LIA individual, England. Kent. East Kent Access Road, United Kingdom (175 BCE-8 CE)
Sample ID: I19869
United Kingdom England LIA 175 calBCE - 8 calCE (2080±30 BP, SUERC-40286) British Late Iron Age T1a1 Direct
AI-generated illustrative portrait of England LIA individual, England. Kent. East Kent Access Road, United Kingdom (200-1 BCE)
Sample ID: I19870
United Kingdom England LIA 200-1 BCE British Late Iron Age T1a1 Direct
AI-generated illustrative portrait of Xinjiang Hetian Antiquity individual, Xinjiang. Hetian Region. Luopu County. Hetian, China (200-400 CE)
Sample ID: C393
China Historical Period Hetian, Xinjiang, China 200-400 CE Hetian Culture T1a1 Direct
AI-generated illustrative portrait of England LIA MIA individual, England. Cornwall. Newquay. Trethellan Farm, United Kingdom (300 BCE-100 CE)
Sample ID: I16386
United Kingdom Middle to Late Iron Age England 300 BCE - 100 CE Late Iron Age British T1a1 Direct
AI-generated illustrative portrait of England LIA MIA individual, England. Cornwall. Newquay. Trethellan Farm, United Kingdom (300 BCE-100 CE)
Sample ID: I16450
United Kingdom Middle to Late Iron Age England 300 BCE - 100 CE Late Iron Age British T1a1 Direct
AI-generated illustrative portrait of England LIA MIA individual, England. Cornwall. Newquay. Trethellan Farm, United Kingdom (300 BCE-100 CE)
Sample ID: I16457
United Kingdom Middle to Late Iron Age England 300 BCE - 100 CE Late Iron Age British T1a1 Direct
AI-generated illustrative portrait of La Tène individual, NW Bohemia. Teplice. Radosevice (Cemetery I), Czech Republic (350-250 BCE)
Sample ID: I14987
Czech Republic Iron Age La Tène Culture, Czech Republic 350-250 BCE La Tène Culture T1a1 Direct
MATERNAL LINEAGE · ANCIENT DNA

Ancient lineage evidence map

Follow parent clades toward this branch and explore where ancient carriers were found.

Loading ancient observations…

Markers are archaeological find locations. A dashed connector is an uncertain, proposed geographic transition between consecutive branches supported by multiple dated observations; it is not an exact travel route, birthplace or proof of direct descent. Parent-clade samples may belong to other descendant branches. Gaps remain where evidence is insufficient. Sample dates differ from haplogroup formation dates.
Reference profile

Carrier Distribution Map

Geographic distribution of 100 ancient DNA samples (direct and subclade carriers of T1A1)

Direct carrier Subclade carrier
Time Period Filter
All Time Periods
Showing all samples
Reference profile

Temporal Distribution

Distribution of carriers across archaeological periods

Reference profile

Geographic Distribution

Counts by recorded sample country. These reflect the available reference selection, not population frequencies.

Reference profile

Country × Era Distribution

Compare recorded sample counts across countries and archaeological periods. Select a populated cell to inspect a sample.

Data

Data & Provenance

Source information and data quality

Last Updated 2026-02-16
Confidence Score 50/100
Coverage Low

Data Source

Classification, estimated dates and geographic context reflect the recorded reference data and may change as evidence is revised. Sample coverage is uneven; recorded locations and archaeological associations do not establish personal origin or cultural identity.

A haplogroup follows one maternal or paternal line. The branch prediction depends on which markers the DNA file contains. How our analysis works