Menu
Currency
Y-DNA Haplogroup • Paternal Lineage

E1B1A

Y-DNA Haplogroup E1B1A

~22,000 years ago
West/Central Africa (likely African interior)
1 subclades
Scroll to explore
Chapter I

The Story

The journey of Y-DNA haplogroup E1B1A

Origins and Evolution

Y-DNA haplogroup E1B1A (in older literature associated with labels such as E-V38 and especially the downstream E-M2 complex) is one of the principal branches of haplogroup E1B1. Based on phylogenetic position beneath E1B1 and the geographic distribution of its descendant lineages, it most likely formed in Africa during the Late Pleistocene, with molecular-clock estimates clustering around ~20–25 kya (we use a midpoint estimate ~22 kya here). After its origin, E1B1A diversified into multiple subclades; during the Holocene these lineages underwent major demographic expansions that reshaped the paternal genetic landscape of sub-Saharan Africa.

There is some debate in the literature about the precise birthplace (East vs. West/Central Africa) because early branching and later back-migrations complicate the picture, but the highest modern diversity and frequency of descendant lineages support an origin in the West/Central African interior followed by rapid regional spread.

Subclades (if applicable)

The E1B1A node gave rise to several major downstream lineages. The best-known and most numerous descendant is E-M2 (often cataloged as E1b1a1 in older nomenclature), which itself radiated into numerous subbranches found across West and Central Africa. Important sublineages frequently referenced in population studies include E-U175, E-M191, and other regionally concentrated clusters. These subclades differentiate further into lineages that are useful for fine-scale reconstruction of recent historic movements (for example, Bantu-language expansions and regional demographic events).

Geographical Distribution

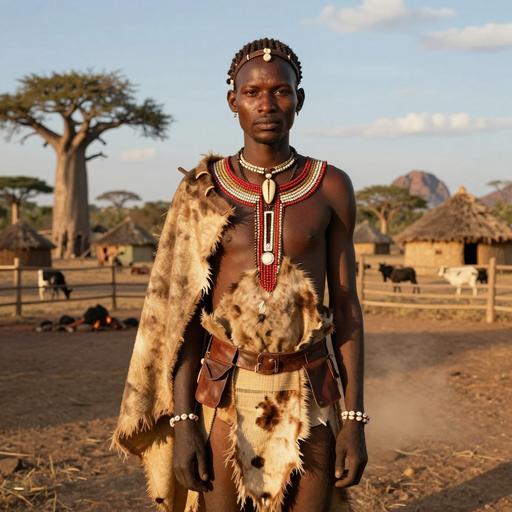
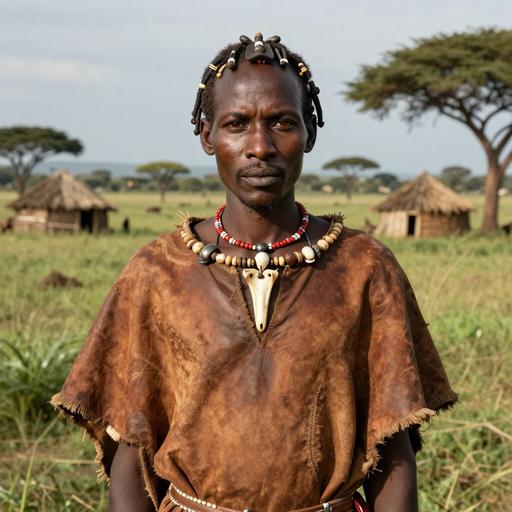
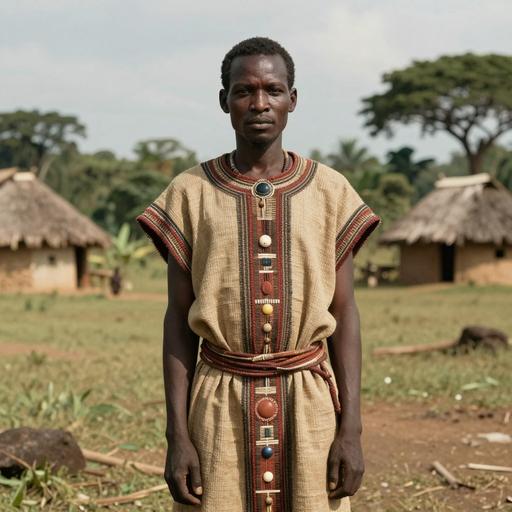
E1B1A and its descendants are overwhelmingly concentrated in sub-Saharan Africa. High frequencies are observed across West Africa (e.g., Yoruba, Akan, Mande-speaking groups), Central Africa (multiple Bantu and non-Bantu groups), and large parts of Southern Africa among Bantu-speaking populations (e.g., Nguni, Sotho groups) due to Holocene demographic expansions.

Moderate frequencies occur in parts of East Africa (including some Nilotic and Cushitic-speaking groups, as well as groups in the Great Lakes region) and in the Sahel (where it overlaps with other regional lineages). Low but detectable frequencies are found in North Africa and in southern European Mediterranean regions, typically reflecting historical contact and gene flow. Because of the transatlantic slave trade, E1B1A-derived lineages are also common among African-descended populations in the Americas and the Caribbean, where they are often the dominant Y-haplogroups within those communities.

Historical and Cultural Significance

E1B1A lineages are intimately tied to major demographic and cultural processes in African prehistory and history. The Holocene expansion of Bantu-speaking peoples (beginning roughly 3–5 kya) carried E1B1A lineages from parts of West/Central Africa into eastern and southern Africa, producing the modern pattern of high frequencies throughout sub-Saharan Africa. In recent historical times, the transatlantic slave trade exported these paternal lineages to the Americas, making E1B1A one of the most common Y-haplogroups in African-descended populations in the New World.

Genetic studies using Y-chromosome markers have used E1B1A substructure to trace migration routes, to estimate timings of expansions, and to correlate genetic patterns with archaeological and linguistic evidence (notably the spread of Bantu languages). It is important, however, to avoid simplistic cultural attributions: Y-haplogroup presence reflects paternal ancestry and can be decoupled from language, culture, and full genome ancestry through processes like language shift, male-biased migrations, and admixture.

Conclusion

E1B1A is a foundational sub-Saharan paternal lineage whose diversification and expansions played a central role in shaping the modern male genetic landscape of Africa and the African diaspora. Its distribution and internal substructure provide powerful tools for reconstructing Holocene demographic events, particularly the Bantu expansions and more recent historical dispersals.

Key Points

  • Origins and Evolution
  • Subclades (if applicable)
  • Geographical Distribution
  • Historical and Cultural Significance
  • Conclusion
Chapter II

Tree & Relationships

Phylogenetic context and subclades

Evolution Path

This haplogroup's evolutionary journey from its earliest ancestor to the present.

Steps Haplogroup Age Estimate Archaeology Era Time Passed Immediate Descendants Tested Modern Descendants Ancient Connections
1 E1B1A Current ~22,000 years ago 🏹 Mesolithic 22,000 years 1 334 0
2 E1B1 ~28,000 years ago 🦴 Paleolithic 28,000 years 2 1,723 0
3 E1B ~30,000 years ago 🦴 Paleolithic 30,000 years 1 1,734 0
4 E1 ~50,000 years ago 🦴 Paleolithic 50,000 years 2 1,825 2
5 E ~50,000 years ago 🦴 Paleolithic 50,000 years 3 1,968 3

Siblings (1)

Other branches from the same parent haplogroup

Chapter III

Where in the World

Geographic distribution and modern presence

Place of Origin

West/Central Africa (likely African interior)

Modern Distribution

The populations where Y-DNA haplogroup E1B1A is found include:

  1. Yoruba and other West African groups (e.g., Akan, Mande-speaking populations)
  2. Bantu-speaking populations across Central, Eastern and Southern Africa (e.g., Kongo, Luba, Zulu)
  3. Mande and other West African coastal groups
  4. Sahelian and Chadic-influenced populations (e.g., parts of Chad, Cameroon)
  5. Some East African groups (at moderate frequencies in parts of the Great Lakes and Horn regions)
  6. Berber and North African populations at low frequencies (reflecting historical gene flow)
  7. Southern European Mediterranean populations at low–moderate frequencies (via historical contact)
  8. African-descended populations in the Americas and Caribbean (via the transatlantic slave trade)

Regional Presence

Western Africa High
Central Africa High
Southern Africa High
Eastern Africa Moderate
North Africa Low
North America Moderate
South America Moderate
Southern Europe Low
North Africa Low
Southern Europe (Mediterranean) Low
CHAPTER IV

When in Time

Your haplogroup in the context of human history

~22k years ago

Haplogroup E1B1A

Your Y-DNA haplogroup emerged in West/Central Africa (likely African interior)

West/Central Africa (likely African interior)
~20k years ago

Last Glacial Maximum

Peak of the last ice age, populations isolated

~10k years ago

Neolithic Revolution

Agriculture begins, settled communities form

~5k years ago

Bronze Age

Metalworking, writing, and early civilizations

~3k years ago

Iron Age

Iron tools, expanded trade networks

~2k years ago

Classical Antiquity

Greek and Roman civilizations flourish

Present

Present Day

Modern era

Your Haplogroup
Historical Era
Chapter IV-B

Linked Cultures

Ancient cultures associated with Y-DNA haplogroup E1B1A

Cultural Heritage

These ancient cultures have been linked to haplogroup E1B1A based on matching ancient DNA samples from archaeological excavations. The presence of this haplogroup in these cultures provides insights into the migrations and population movements of populations carrying this haplogroup.

Danish Medieval Early Avar Iberomaurusian Roman Provincial Songo Mnara Tell Atchana
Culture assignments are based on archaeological context of ancient DNA samples and may represent regional associations during specific time periods.
Chapter V

Sample Catalog

8 subclade carriers of haplogroup E1B1A (no exact E1B1A samples sequenced yet)

8 / 8 samples
Portrait Sample Country Era Date Culture Y-DNA Match
Portrait of ancient individual XAR001 from Botswana, dated 700 CE - 1000 CE
XAR001
Botswana Xaro Early Iron Age in Botswana 700 CE - 1000 CE Xaro Culture E1b1a1a1c1a Downstream
Portrait of ancient individual I8802 from Kenya, dated 772 BCE - 957 BCE
I8802
Kenya Iron Age Pastoral in Kenya 772 BCE - 957 BCE Iron Age Pastoral E1b1a1a1a1a Downstream
Portrait of ancient individual KIN002 from DR Congo, dated 1645 CE - 1950 CE
KIN002
DR Congo Kindoki Protohistoric Era in Congo 1645 CE - 1950 CE Kindoki E1b1a1a1d1a2 Downstream
Portrait of ancient individual HGDP01030 from BotswanaOrNamibia, dated 2000 CE
HGDP01030
BotswanaOrNamibia present 2000 CE E1b1a1a1a1c4~ Downstream
Portrait of ancient individual HGDP01034 from BotswanaOrNamibia, dated 2000 CE
HGDP01034
BotswanaOrNamibia present 2000 CE E1b1a1a1a1c1a1a3c2b Downstream
Portrait of ancient individual HG02464 from Gambia, dated 2000 CE
HG02464
Gambia present 2000 CE E1b1a1a1a1c2c Downstream
Portrait of ancient individual HG03100 from Nigeria, dated 2000 CE
HG03100
Nigeria present 2000 CE E1b1a1a1a2a1a3a2a Downstream
Portrait of ancient individual HG03078 from Sierra Leone, dated 2000 CE
HG03078
Sierra Leone present 2000 CE E1b1a1a1a1c2c3a Downstream
Chapter VI

Carrier Distribution Map

Geographic distribution of 8 ancient DNA samples (direct and subclade carriers of E1B1A)

Subclade carrier
Time Period Filter
All Time Periods
Showing all samples
Chapter VII

Temporal Distribution

Distribution of carriers across archaeological periods

Chapter VIII

Geographic Distribution

Distribution by country of origin (direct and subclade carriers shown by default)

Chapter IX

Country × Era Distribution

Cross-tabulation of carrier countries and archaeological periods (direct and subclade carriers shown by default)

Data

Data & Provenance

Source information and data quality

Last Updated 2026-06-15
Confidence Score 50/100
Coverage Low
Data Source

We use the latest phylotree for YDNA haplogroup classification and data.