Y-DNA · Paternal lineage

G2A

Y-DNA Haplogroup G2A

A reference profile for one lineage branch. Shared haplogroups do not establish a family relationship or cultural identity.

Reference profile

Branch background

Historical context for Y-DNA lineage branch G2A

Origins and Evolution

Y-DNA haplogroup G2A is a downstream branch of haplogroup G2 and is best understood as the lineage most closely linked to the early Neolithic farming expansions from Anatolia and the Near East into Europe. Based on phylogenetic position and ancient DNA evidence, G2A likely diversified in the Near East or Anatolia during the early Holocene (roughly 8–10 kya) and accompanied migrating farming communities into Europe by both continental (LBK-style) and maritime (Cardial/Impressed Ware) routes.

Genetic studies of Early European Farmers (EEF) and ancient Anatolian individuals repeatedly recover high proportions of G2A lineages, indicating a strong founder effect during the Neolithic dispersal. Later demographic events — notably the Bronze Age migrations from the Pontic-Caspian steppe carrying R1a/R1b lineages — greatly reduced the relative frequency of G2A across much of Europe, though pockets of higher frequency and diversity remain in some regions.

Subclades

G2A comprises multiple subclades with differing geographic signatures. Ancient DNA and modern surveys show a variety of downstream branches; some are most common among Neolithic-derived populations in Europe, while others retain greater diversity in Anatolia and the Caucasus. Modern subclades of G2A can be locally concentrated (for example in parts of Southern Europe or in the Caucasus), reflecting both the initial Neolithic founder effects and subsequent regional demographic histories. Detailed SNP-based subclade assignments (from high-resolution testing) refine migration and local continuity patterns but the overall pattern remains: G2A is a hallmark of early farmer ancestry.

Geographical Distribution

Today G2A is distributed in a patchy way that reflects ancient migration, drift, and later population replacements. Key features of its distribution are:

  • High representation in ancient Neolithic samples across central and western Europe (LBK, Cardial contexts) and in early Anatolian farmer remains.
  • Persisting elevated frequencies in parts of Southern Europe (notably Sardinia, parts of Italy and the western Mediterranean) where Neolithic ancestry remained relatively insulated from later steppe influxes.
  • A presence in the Caucasus and parts of the Near East and Anatolia, where overall G diversity (including non-G2A branches) is greatest.
  • Low but detectable frequencies in parts of Western Europe, the eastern Mediterranean, North Africa, and Central Asia reflecting complex historical contacts.

Ancient DNA demonstrates that G2A was much more common in European populations prior to the Bronze Age; modern distributions therefore underrepresent the Neolithic demographic importance of this haplogroup.

Historical and Cultural Significance

G2A's principal significance in population genetics and archaeology stems from its tight association with the Neolithic agricultural transition in Europe. In many early farmer sites (LBK, Cardial, and other Neolithic contexts), G2A forms a major component of male lineages, linking genetic data to archaeological models of migration and cultural transmission of farming technology.

As Europe moved into the Bronze Age, large-scale migrations from the steppe introduced different paternal lineages and reshaped the male-biased genetic landscape; G2A commonly declined in frequency but remained important for reconstructing the Neolithic substrate in modern populations and in ancient demographic models. G2A is also of interest in studies of the Caucasus and Anatolia, where high diversity of haplogroup G suggests long-term regional continuity and inferences about refugia and local differentiation.

Conclusion

G2A is a cornerstone lineage for understanding the Neolithic spread of farming from Anatolia/Near East into Europe. Its prominence in ancient farmer genomes, coupled with persistence in southern and island populations today, makes it a key marker for tracing early agriculturalist migrations, subsequent demographic shifts, and regional continuity in Europe and the Near East. High-resolution subclade analysis continues to refine routes and timings of these events as more ancient and modern genomes are analyzed.

Key Points

  • Origins and Evolution
  • Subclades
  • Geographical Distribution
  • Historical and Cultural Significance
  • Conclusion
Reference profile

Tree & Relationships

Phylogenetic context and subclades

Evolution Path

Follow the recorded parent branches toward G2A. Dates are estimates and can change as reference data is revised.

Steps Haplogroup Age Estimate Archaeology Era Time Passed Immediate Descendants Tested Modern Descendants Ancient Connections
1 G2A Current ~9,000 years ago Neolithic 9,000 years 2 910 14
2 G2 ~25,000 years ago Paleolithic 25,000 years 2 989 9
3 G ~30,000 years ago Paleolithic 30,000 years 3 1,171 7

Siblings (1)

Other branches from the same parent haplogroup

Reference profile

Where in the World

Geographic distribution and modern presence

Recorded origin

Near East / Anatolia / Caucasus

Modern Distribution

The populations where Y-DNA haplogroup G2A is found include:

  1. Caucasus populations (e.g., Georgians and other groups showing high G diversity)
  2. Anatolian and Near Eastern populations (Turkey, parts of the Levant)
  3. Early European farmer-descended and modern Southern/Western Europeans (e.g., Sardinians, parts of Italy, the western Mediterranean)
  4. Neolithic archaeological contexts across Europe (LBK, Cardial sites)
  5. Some Jewish communities and scattered Central Asian or North African lineages

Regional Presence

Caucasus High
West Asia / Near East (Anatolia, Levant, Iran) High
Mediterranean Europe (Sardinia, Italy, coastal regions) Moderate
Western & Central Europe Low
Central Asia Low
South Asia Low
Southern Europe High
North Africa Low
Historical context

A branch through time

Estimated formation in a broad historical timeline. Period markers provide context and do not imply a connection with particular cultures.

  1. ~10k years ago

    Neolithic Revolution

    Agriculture begins, settled communities form

  2. ~9k years ago

    Haplogroup G2A

    Estimated formation of this Y-DNA branch; dates and locations are reference estimates.

    This branch
  3. ~5k years ago

    Bronze Age

    Metalworking, writing, and early civilizations

  4. ~3k years ago

    Iron Age

    Iron tools, expanded trade networks

  5. ~2.5k years ago

    Classical Antiquity

    Greek and Roman civilizations flourish

  6. Present

    Present Day

    Modern era

Reference profile

Archaeological context

Recorded archaeological associations for Y-DNA branch G2A

Recorded associations

These labels describe archaeological contexts recorded for reference samples linked to G2A. An association does not establish that all carriers belonged to a culture or followed a particular migration route.

Bodrogkeresztur French Late Neolithic French Neolithic Impressed Ware Culture Lengyel Culture Linear Pottery Culture Shanidar Culture Sopot Culture Tisza Culture Trypillia Culture Turkey_Catalhoyuk_EN Turkey_Catalhoyuk_N
Culture assignments are based on archaeological context of ancient DNA samples and may represent regional associations during specific time periods.
Reference profile

Sample Catalog

9 direct carriers and 5 subclade carriers of haplogroup G2A

10 shown · 14 matching samples

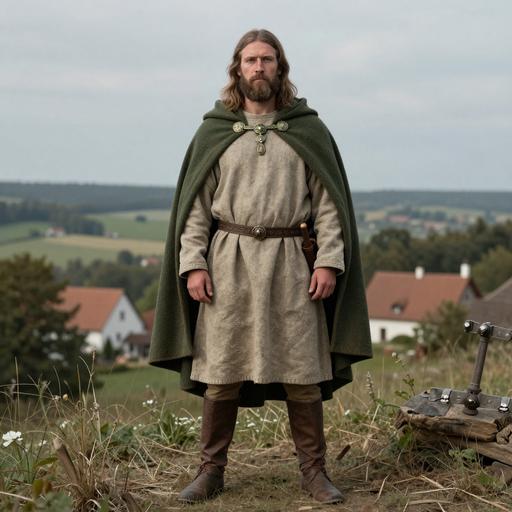
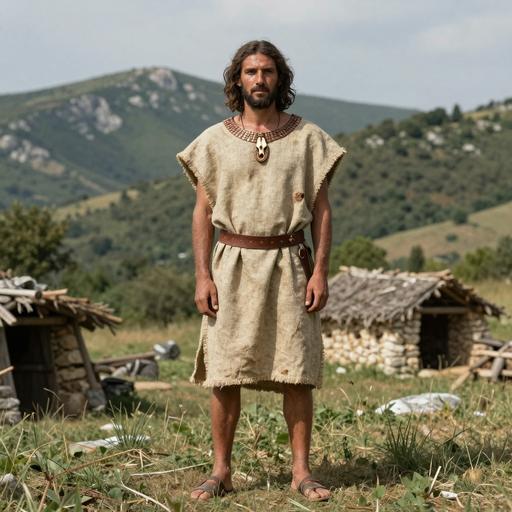
Portraits are AI-generated illustrations. Sample labels and accession IDs identify the reference records.

Portrait Sample Country Era Date Culture Y-DNA Match
AI-generated illustrative portrait of Norse individual, Funen. Galgedil, Denmark (800-1,100 CE)
Sample ID: VK140
Denmark Denmark Viking 800 CE - 1100 CE Viking Denmark G2a Direct
AI-generated illustrative portrait of Contemporary individual, Chinese. Sino-Tibetan. Shanxi. Y.haplogroup=G2a, China (c. 2,000 CE)
Sample ID: Han1843
China Modern China 2000 CE Chinese G2a Direct
AI-generated illustrative portrait of Contemporary individual, Tibetic. Bodish. Sino-Tibetan. Gangcha. Qinghai. Y.haplogroup=G2a, China (c. 2,000 CE)
Sample ID: QH5
China Modern China 2000 CE Chinese G2a Direct
AI-generated illustrative portrait of Contemporary individual, Tibetic. Bodish. Sino-Tibetan. Gangcha. Qinghai. Y.haplogroup=G2a, China (c. 2,000 CE)
Sample ID: QH14
China Modern China 2000 CE Chinese G2a Direct
AI-generated illustrative portrait of Contemporary individual, Mongolic. Linxia. Gansu. Y.haplogroup=G2a, China (c. 2,000 CE)
Sample ID: DX1146
China Modern China 2000 CE Chinese G2a Direct
AI-generated illustrative portrait of Contemporary individual, Mongolic. Sunan. Gansu. Y.haplogroup=G2a, China (c. 2,000 CE)
Sample ID: EYG06
China Modern China 2000 CE Chinese G2a Direct
AI-generated illustrative portrait of Iberian Chalcolithic individual, Burgos. Atapuerca. El Mirador Cave, Spain (2,900-2,300 BCE)
Sample ID: I1314
Spain Spain C 2900 BCE - 2300 BCE Los Millares G2a Direct
AI-generated illustrative portrait of LN Sopot individual, Alsónyék-Elkerülő 2, Hungary (5,034-4,846 BCE)
Sample ID: I1893
Hungary Hungary LN Sopot 5034-4846 calBCE (6049±29 BP, MAMS-14817) Sopot Culture G2a Direct
AI-generated illustrative portrait of MN LBK-o individual, Tolna-Mözs TO26, Hungary (5,303-5,066 BCE)
Sample ID: I1883
Hungary Hungary MN LBK 5303-5066 calBCE (6233±23 BP, MAMS-14145) Linear Pottery Culture G2a Direct
AI-generated illustrative portrait of Alt Inden Early Medieval individual, North Rhine-Westphalia. Alt-Inden, Germany (400-800 CE)
Sample ID: IND015
Germany Saxon Early Medieval Alt Inden, Germany 400-800 CE Saxon Culture G2a2 Subclade
PATERNAL LINEAGE · ANCIENT DNA

Ancient lineage evidence map

Follow parent clades toward this branch and explore where ancient carriers were found.

Loading ancient observations…

Markers are archaeological find locations. A dashed connector is an uncertain, proposed geographic transition between consecutive branches supported by multiple dated observations; it is not an exact travel route, birthplace or proof of direct descent. Parent-clade samples may belong to other descendant branches. Gaps remain where evidence is insufficient. Sample dates differ from haplogroup formation dates.

Reference profile

Carrier Distribution Map

Geographic distribution of 14 ancient DNA samples (direct and subclade carriers of G2A)

Direct carrier Subclade carrier
Time Period Filter
All Time Periods
Showing all samples
Reference profile

Temporal Distribution

Distribution of carriers across archaeological periods

Reference profile

Geographic Distribution

Counts by recorded sample country. These reflect the available reference selection, not population frequencies.

Reference profile

Country × Era Distribution

Compare recorded sample counts across countries and archaeological periods. Select a populated cell to inspect a sample.

Data

Data & Provenance

Source information and data quality

Last Updated 2026-06-16
Confidence Score 50/100
Coverage Low

Data Source

Classification, estimated dates and geographic context reflect the recorded reference data and may change as evidence is revised. Sample coverage is uneven; recorded locations and archaeological associations do not establish personal origin or cultural identity.