Y-DNA · Paternal lineage

G

G (M201)

Y-DNA Haplogroup G

A reference profile for one lineage branch. Shared haplogroups do not establish a family relationship or cultural identity.

Reference profile

Branch background

Historical context for Y-DNA lineage branch G

Origins and Evolution

Haplogroup G (M201) is an early West Eurasian Y-chromosome lineage that likely arose in the Near East or Caucasus region during the Upper Paleolithic (roughly ~30 kya by current coalescent estimates). Its highest modern diversity and several deep branching sublineages are concentrated in the Caucasus and adjacent parts of western Asia, which supports an origin and long-term presence in that area. G sits downstream of early branches of haplogroup F-derived lineages and forms a distinct paternal clade that later diversified into geographically and historically important subclades.

Ancient DNA (aDNA) studies have revealed that one of G's major sublineages, G2a, became prominent among Neolithic farmers in Anatolia and Europe. This Neolithic expansion left a clear genetic signature in early farming communities across continental Europe, though many of these G2a lineages declined in frequency with later Bronze Age and Iron Age demographic events.

Subclades

The haplogroup has several well-characterized subclades with differing geographic profiles:

  • G1 — Relatively rare overall but concentrated in Iran, parts of Central Asia and some Caucasus populations. G1 shows affinities with certain Iranian plateau and Central Asian groups.
  • G2 — The dominant branch in most studies; it includes numerous downstream clades. Important subbranches include:
    • G2a (P15 and downstream) — Highly associated with Anatolian and European early farmers (Neolithic); frequently found in ancient Neolithic samples and present at low-to-moderate levels in modern Europeans (notably in Sardinia and some Mediterranean populations).
    • G2b — Less common, found sporadically in the Near East, South Asia, and some European populations.

Each subclade displays different geographic concentrations that reflect both deep Paleolithic structure and more recent Neolithic and post-Neolithic movements.

Geographical Distribution

Modern frequency patterns show highest concentrations in the Caucasus and neighbouring western Asia, with moderate frequencies across the Near East and lower but notable presence in parts of Europe. Specific features include:

  • Caucasus: Several ethnic groups (e.g., some North Caucasus populations and Georgians) carry G at relatively high frequencies and with substantial internal diversity, consistent with a long-term resident population.
  • Anatolia and Near East: G is common in Anatolia and parts of the Near East, matching its role in Neolithic expansions originating from Anatolia.
  • Europe: Present at low-to-moderate frequencies in many European populations; elevated in specific refugial or island populations (e.g., Sardinians) and detected in ancient Neolithic farmer burials across continental Europe.
  • Central/South Asia and North Africa: Low-frequency occurrences reflect historical gene flow and migrations between West Eurasia and neighboring regions.

Historical and Cultural Significance

Haplogroup G is most notable for its association with the Neolithic agricultural expansion from Anatolia into Europe. Ancient DNA demonstrates that many of the earliest European farming communities (e.g., Linearbandkeramik/LBK and Cardial cultures) carried G2a lineages, linking paternal ancestry to Anatolian farmers who dispersed farming practices and domesticates across Europe about 8–7 kya.

G's deeper history in the Caucasus and Near East suggests it was part of pre-agricultural West Eurasian populations as well; later cultural shifts (Bronze Age steppe expansions dominated by R1a/R1b, later migrations) reshaped European Y-chromosome landscapes and reduced the relative frequency of G in many regions.

Conclusion

Haplogroup G is a key lineage for understanding West Eurasian prehistory. Its deep roots in the Caucasus/Near East, and the prominent Neolithic signal carried by G2a, make it critical for reconstructing the spread of agriculture into Europe and the demographic processes that followed. While not a dominant lineage in most modern European populations, G's distribution and subclade structure preserve signals of both Upper Paleolithic settlement in western Asia and the major cultural transition represented by the Neolithic farming expansion.

Key Points

  • Origins and Evolution
  • Subclades
  • Geographical Distribution
  • Historical and Cultural Significance
  • Conclusion
Reference profile

Tree & Relationships

Phylogenetic context and subclades

Evolution Path

Follow the recorded parent branches toward G. Dates are estimates and can change as reference data is revised.

Steps Haplogroup Age Estimate Archaeology Era Time Passed Immediate Descendants Tested Modern Descendants Ancient Connections
1 G Current ~30,000 years ago Paleolithic 30,000 years 3 1,171 7
Reference profile

Where in the World

Geographic distribution and modern presence

Recorded origin

Near East / Caucasus

Modern Distribution

The populations where Y-DNA haplogroup G is found include:

  1. Caucasus populations (e.g., Georgians, some North Caucasus groups)
  2. Anatolian and Near Eastern populations (Turkey, parts of the Levant)
  3. Early European farmer-descended groups and modern Southern/Western Europeans (e.g., Sardinians, some Mediterranean populations)
  4. Iranian and Central Asian groups (notably for G1)
  5. Jewish communities (occurring in some Ashkenazi and Sephardi paternal lines)

Regional Presence

Caucasus High
Western Asia (Near East / Caucasus) High
Western Europe Moderate
Southern Europe Moderate
Central Asia Low
South Asia Low
North Africa Low
Historical context

A branch through time

Estimated formation in a broad historical timeline. Period markers provide context and do not imply a connection with particular cultures.

  1. ~30k years ago

    Haplogroup G

    Estimated formation of this Y-DNA branch; dates and locations are reference estimates.

    This branch
  2. ~20k years ago

    Last Glacial Maximum

    Peak of the last ice age, populations isolated

  3. ~10k years ago

    Neolithic Revolution

    Agriculture begins, settled communities form

  4. ~5k years ago

    Bronze Age

    Metalworking, writing, and early civilizations

  5. ~3k years ago

    Iron Age

    Iron tools, expanded trade networks

  6. ~2.5k years ago

    Classical Antiquity

    Greek and Roman civilizations flourish

  7. Present

    Present Day

    Modern era

Reference profile

Archaeological context

Recorded archaeological associations for Y-DNA branch G

Recorded associations

These labels describe archaeological contexts recorded for reference samples linked to G. An association does not establish that all carriers belonged to a culture or followed a particular migration route.

Anatolian Neolithic Çayönü Culture French Neolithic Linear Pottery Culture Middle Chalcolithic Pottery Neolithic Romanian Neolithic Turkey_Catalhoyuk_EarlyC_LN Turkey_Catalhoyuk_LN Turkey_Catalhoyuk_MN Turkey_Catalhoyuk_N
Culture assignments are based on archaeological context of ancient DNA samples and may represent regional associations during specific time periods.
Reference profile

Sample Catalog

4 direct carriers and 3 subclade carriers of haplogroup G

7 shown · 7 matching samples

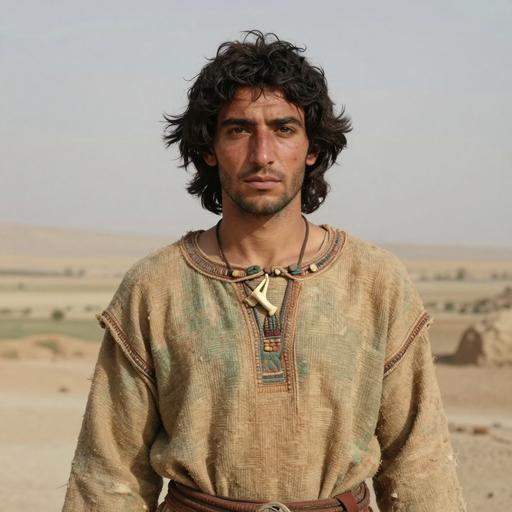
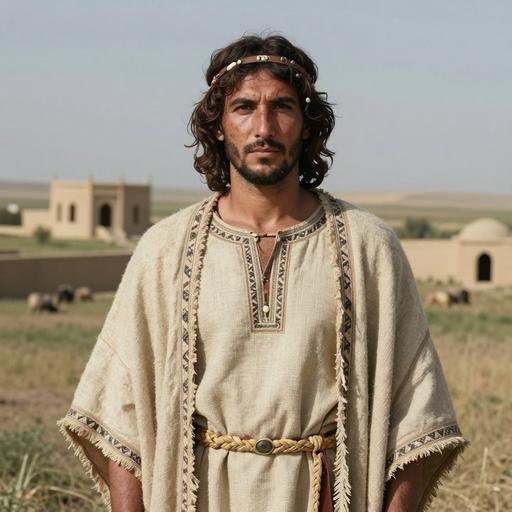
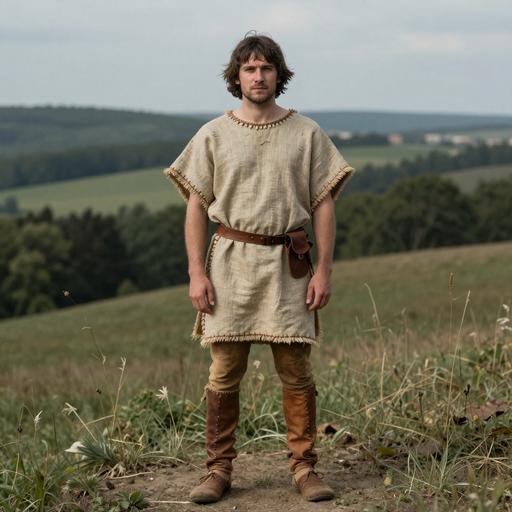
Portraits are AI-generated illustrations. Sample labels and accession IDs identify the reference records.

Portrait Sample Country Era Date Culture Y-DNA Match
AI-generated illustrative portrait of IA Wielbark individual, Kowalewko (Greater Poland Province, Oborniki), Poland (45-77 CE)
Sample ID: PCA0057
Poland Wielbark Culture 45-77 calCE Wielbark G Direct
AI-generated illustrative portrait of Yonne N individual, Gurgy Les Noisats (Bourgogne-Franche-Comté Region, Yonne Department, Auxerre arrondissement), France (5,300-3,900 BCE)
Sample ID: GLN270B
France France N 4800-4550 BCE French Neolithic G Direct
AI-generated illustrative portrait of N LBK individual, Nitra-Horné-Krškany (Nitra Region, Nitra District, Nitra), Slovakia (5,400-4,900 BCE)
Sample ID: I11866
Slovakia Slovakia N LBK 5400-4900 BCE Linear Pottery Culture G Direct
AI-generated illustrative portrait of PPN individual, Boncuklu (Diyarbakır, Ergani), Turkey (6,475-6,269 BCE)
Sample ID: cay011
Turkey Çayönü Pre-Pottery Neolithic Culture 6475-6269 calBCE (7562±38 BP) Çayönü Culture G Direct
AI-generated illustrative portrait of Alkhantepe Late C individual, Jalilabad district. Uchtepe village. Alkhantepe, Azerbaijan (3,776-3,651 BCE)
Sample ID: ALX002
Azerbaijan Late Chalcolithic Azerbaijan 3776-3651 calBCE (4950±23 BP, MAMS-40330) Late Chalcolithic Azerbaijani G1 Subclade
AI-generated illustrative portrait of Halberstadt Sonntagsfeld EN individual, Saxony-Anhalt. Halberstadt, Germany (5,250-4,800 BCE)
Sample ID: HBS005
Germany Early Neolithic Linear Pottery Culture, Germany 5250-4800 BCE Linear Pottery Culture G2 Subclade
AI-generated illustrative portrait of EMN individual, Lepenski Vir, Serbia (6,223-6,064 BCE)
Sample ID: LEPE52
Serbia Early to Middle Neolithic Lepenski Vir, Serbia 6223-6064 calBCE (7265±30 BP, [FRE:6983±47 BP], BA-10652) Lepenski Vir Culture G2 Subclade
PATERNAL LINEAGE · ANCIENT DNA

Ancient lineage evidence map

Follow parent clades toward this branch and explore where ancient carriers were found.

Loading ancient observations…

Markers are archaeological find locations. A dashed connector is an uncertain, proposed geographic transition between consecutive branches supported by multiple dated observations; it is not an exact travel route, birthplace or proof of direct descent. Parent-clade samples may belong to other descendant branches. Gaps remain where evidence is insufficient. Sample dates differ from haplogroup formation dates.

Reference profile

Carrier Distribution Map

Geographic distribution of 7 ancient DNA samples (direct and subclade carriers of G)

Direct carrier Subclade carrier
Time Period Filter
All Time Periods
Showing all samples
Reference profile

Temporal Distribution

Distribution of carriers across archaeological periods

Reference profile

Geographic Distribution

Counts by recorded sample country. These reflect the available reference selection, not population frequencies.

Reference profile

Country × Era Distribution

Compare recorded sample counts across countries and archaeological periods. Select a populated cell to inspect a sample.

Data

Data & Provenance

Source information and data quality

Last Updated 2026-06-16

Data Source

Classification, estimated dates and geographic context reflect the recorded reference data and may change as evidence is revised. Sample coverage is uneven; recorded locations and archaeological associations do not establish personal origin or cultural identity.