mtDNA · Maternal lineage

R1A1

mtDNA Haplogroup R1A1

A reference profile for one lineage branch. Shared haplogroups do not establish a family relationship or cultural identity.

Reference profile

Branch background

Historical context for mtDNA lineage branch R1A1

Origins and Evolution

mtDNA haplogroup R1A1 is a downstream branch of haplogroup R1A, itself a regional derivative of haplogroup R that became established in South Asia during the Late Upper Paleolithic. Based on phylogenetic position and the inferred age of the parent clade, R1A1 most likely arose after the Last Glacial Maximum (LGM) in a South Asian refugium or locally expanding population roughly in the range of the Late Pleistocene to early Holocene (estimated ~18 kya). Its emergence reflects continued diversification of R-derived maternal lineages within South Asia as hunter-gatherer groups adapted to post-glacial environments and later cultural transitions.

Subclades

As a subclade of R1A, R1A1 may contain further downstream branches defined by private control-region and coding-region mutations identified in population sampling and a small number of ancient DNA contexts. Where sampling density is limited, subclade resolution is incomplete; additional whole-mitochondrial sequencing in South and Central Asia is likely to reveal more internal structure. Current evidence indicates R1A1 is one of several regional offshoots of R that contributed to the maternal diversity of South Asia alongside sister lineages such as R1B/R2.

Geographical Distribution

R1A1 is concentrated in South Asia, especially among populations in the Indian subcontinent (India, Pakistan, Sri Lanka), where it is most commonly sampled. It also occurs at moderate to low frequencies in Central Asia (e.g., Tajik and Uzbek populations and neighboring groups), and at low, sporadic frequencies in parts of Southeast and East Asia — often in coastal or long-distance contact populations. Modern diaspora communities with South Asian ancestry (South Asian diasporas in Europe, North America, and elsewhere) also carry R1A1 at low frequencies due to recent migration. The geographic pattern is consistent with an origin within South Asia followed by limited regional dispersals rather than a major continent-scale expansion.

Historical and Cultural Significance

Because R1A1 is primarily a South Asian maternal lineage that predates many recent cultural complexes, its significance is largely in tracing prehistoric population structure and continuity in the subcontinent. The lineage likely persisted through Mesolithic and Neolithic periods, contributing maternally to populations that later participated in regional cultural developments. In regions where it occurs at low frequency outside South Asia, its presence often reflects historical contacts, trade, migration, or small-scale gene flow rather than mass replacement. Limited ancient DNA hits attributed to R1A1 indicate continuity in at least some archaeological contexts, but the sample size remains small and conclusions should be cautious.

Conclusion

mtDNA R1A1 represents a regional maternal branch of the R macro-haplogroup that diversified in South Asia after the LGM and remains most characteristic of South Asian maternal lineages. It is useful for studies of South Asian prehistory, patterns of maternal continuity versus admixture, and tracing low-frequency dispersals into Central, Southeast and East Asia and modern diasporas. Greater sequencing coverage and ancient DNA sampling across South and Central Asia will refine its internal structure, age estimates, and historical dynamics.

Key Points

  • Origins and Evolution
  • Subclades
  • Geographical Distribution
  • Historical and Cultural Significance
  • Conclusion
Reference profile

Tree & Relationships

Phylogenetic context and subclades

Evolution Path

Follow the recorded parent branches toward R1A1. Dates are estimates and can change as reference data is revised.

Steps Haplogroup Age Estimate Archaeology Era Time Passed Immediate Descendants Tested Modern Descendants Ancient Connections
1 R1A1 Current ~18,000 years ago Mesolithic 18,000 years 1 9 0
2 R1A ~25,000 years ago Paleolithic 25,000 years 1 10 8
3 R1 ~40,000 years ago Paleolithic 40,000 years 2 12 8
4 R ~55,000 years ago Paleolithic 55,000 years 17 22,830 57
5 NA - - - 1 22,830 0
6 N ~60,000 years ago Paleolithic 60,000 years 16 26,150 13
7 L3 ~70,000 years ago Paleolithic 70,000 years 7 30,162 6
8 L3'4 - - - 2 30,212 0
9 L3'4'6 - - - 2 30,216 0
10 L2'3'4'6 - - - 2 31,333 0
11 L2'3'4'5'6'7 - - - 2 31,349 0
12 L1'2'3'4'5'6'7 - - - 2 31,852 0
13 L ~160,000 years ago Paleolithic 160,000 years 2 32,236 5
Reference profile

Where in the World

Geographic distribution and modern presence

Recorded origin

South Asia

Modern Distribution

The populations where mtDNA haplogroup R1A1 is found include:

  1. South Asian populations (India, Pakistan, Sri Lanka)
  2. Central Asian populations (e.g., Tajik, Uzbek and neighboring groups)
  3. Southeast Asian populations (low frequency; e.g., mainland SE Asian groups)
  4. East Asian populations (sporadic, low frequency occurrences)
  5. Diaspora communities with South Asian ancestry
Historical context

A branch through time

Estimated formation in a broad historical timeline. Period markers provide context and do not imply a connection with particular cultures.

  1. ~20k years ago

    Last Glacial Maximum

    Peak of the last ice age, populations isolated

  2. ~18k years ago

    Haplogroup R1A1

    Estimated formation of this mtDNA branch; dates and locations are reference estimates.

    This branch
  3. ~10k years ago

    Neolithic Revolution

    Agriculture begins, settled communities form

  4. ~5k years ago

    Bronze Age

    Metalworking, writing, and early civilizations

  5. ~3k years ago

    Iron Age

    Iron tools, expanded trade networks

  6. ~2.5k years ago

    Classical Antiquity

    Greek and Roman civilizations flourish

  7. Present

    Present Day

    Modern era

Reference profile

Archaeological context

Recorded archaeological associations for mtDNA branch R1A1

Recorded associations

These labels describe archaeological contexts recorded for reference samples linked to R1A1. An association does not establish that all carriers belonged to a culture or followed a particular migration route.

ANATOLIAN_BRONZE_AGE Caucasus Chalcolithic Early Bronze Age Armenian Maikop-Novosvobodnaya North Caucasus Culture Russia_Rostov_EBA_Don_Yamnaya Ukraine_Odesa_EBA_Catacomb_Yamnaya_possible Yamnaya Yamnaya Culture
Culture assignments are based on archaeological context of ancient DNA samples and may represent regional associations during specific time periods.
Reference profile

Sample Catalog

1 direct carrier and 24 subclade carriers of haplogroup R1A1

10 shown · 25 matching samples

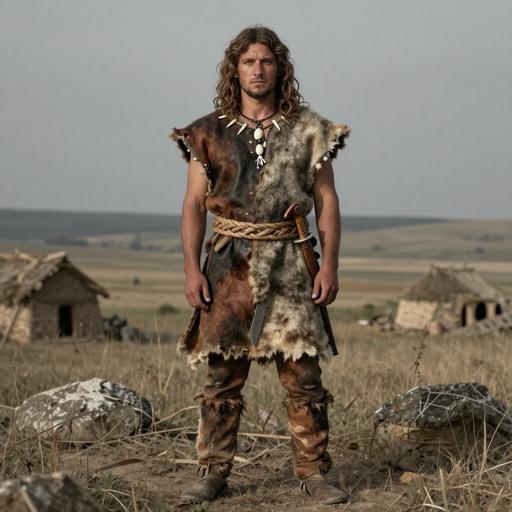
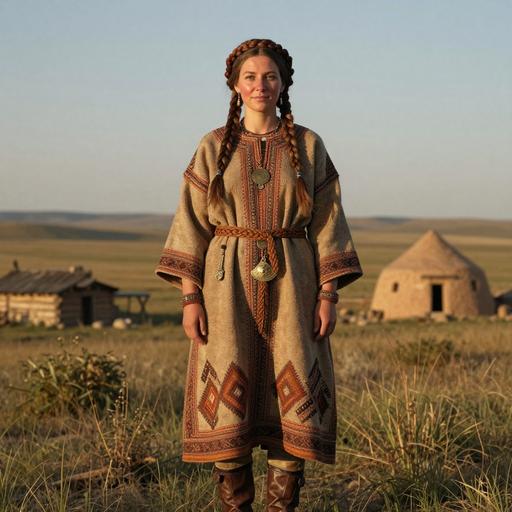
Portraits are AI-generated illustrations. Sample labels and accession IDs identify the reference records.

Portrait Sample Country Era Date Culture mtDNA Match
AI-generated illustrative portrait of Kaps EBA Kura Araxes individual, South Caucasus mountains. Kaps, Armenia (3,625-3,369 BCE)
Sample ID: ARM001
Armenia Early Bronze Age Armenia 3625-3369 calBCE (4695±40 BP, KIA-44691) Early Bronze Age Armenian R1a1 Direct
AI-generated illustrative portrait of LIA Scythian individual, Maslyny (Crimea, Crimea ), Ukraine (162 BCE-10 CE)
Sample ID: UKR052
Ukraine Ukraine LIA Scythian 150-1 BCE Ukraine_LIA_Scythian R1a1a Subclade
AI-generated illustrative portrait of Karnut EBA EIA individual, Karnut Archaeological Complex, Armenia (931-816 BCE)
Sample ID: I16707
Armenia Iron Age Armenia 931-816 calBCE (2740±25 BP, PSUAMS-7829) Iron Age Armenian R1a1a Subclade
AI-generated illustrative portrait of Norse individual, Nor Mid. Trondheim, Norway (1,100-1,300 CE)
Sample ID: VK114
Norway Norway Medieval 1100 CE - 1300 CE Medieval Norse R1a1a Subclade
AI-generated illustrative portrait of Nordic Ma individual, Nor Mid. Trondheim, Norway (1,100-1,300 CE)
Sample ID: VK114
Norway Medieval Nordic Region 1100 CE - 1300 CE 1984 R1a1a Subclade
AI-generated illustrative portrait of Karashamb LBA EIA individual, Karashamb Cemetery, Armenia (1,250-1,100 BCE)
Sample ID: I19342
Armenia Late Bronze Age Armenia 1400-900 BCE Late Bronze Age Armenian R1a1a Subclade
AI-generated illustrative portrait of BA Protohistoric Bell Beaker individual, Morbihan. Quiberon. Beg-er-Vil, France (1,881-1,691 BCE)
Sample ID: I16791
France France BA 1881-1691 calBCE (3460±25 BP, PSUAMS-9422) French Bronze Age R1a1a Subclade
AI-generated illustrative portrait of Omsk EMBA Irtysh Seima Turbino-2 individual, Rostovka (Omsk Oblast, Omsk District, Rostovka Village), Russia (1,920-1,744 BCE)
Sample ID: I11049
Russia Russia Omsk EMBA Irtysh SeimaTurbino 2 1926-1754 calBCE (3520±20 BP, PSUAMS-9093) Russia_Omsk_EMBA_Irtysh_SeimaTurbino-2 R1a1a Subclade
AI-generated illustrative portrait of BA Protohistoric Bell Beaker individual, Morbihan. Quiberon. Beg-er-Vil, France (1,950-1,650 BCE)
Sample ID: I16792
France France BA Protohistoric 1950-1650 BCE French Bronze Age R1a1a Subclade
AI-generated illustrative portrait of Haunstetten Unterer Talweg5862 EBA individual, Haunstetten - Unterer Talweg 58-62, Germany (2,008-1,775 BCE)
Sample ID: UNTA58_153
Germany Early Bronze Age Lech Valley, Germany 2008-1775 calBCE (3553±24 BP, MAMS-18943) Lech Valley Bronze Age R1a1a Subclade
MATERNAL LINEAGE · ANCIENT DNA

Ancient lineage evidence map

Follow parent clades toward this branch and explore where ancient carriers were found.

Loading ancient observations…

Markers are archaeological find locations. A dashed connector is an uncertain, proposed geographic transition between consecutive branches supported by multiple dated observations; it is not an exact travel route, birthplace or proof of direct descent. Parent-clade samples may belong to other descendant branches. Gaps remain where evidence is insufficient. Sample dates differ from haplogroup formation dates.

Reference profile

Carrier Distribution Map

Geographic distribution of 25 ancient DNA samples (direct and subclade carriers of R1A1)

Direct carrier Subclade carrier
Time Period Filter
All Time Periods
Showing all samples
Reference profile

Temporal Distribution

Distribution of carriers across archaeological periods

Reference profile

Geographic Distribution

Counts by recorded sample country. These reflect the available reference selection, not population frequencies.

Reference profile

Country × Era Distribution

Compare recorded sample counts across countries and archaeological periods. Select a populated cell to inspect a sample.

Data

Data & Provenance

Source information and data quality

Last Updated 2026-02-16
Confidence Score 50/100
Coverage Low

Data Source

Classification, estimated dates and geographic context reflect the recorded reference data and may change as evidence is revised. Sample coverage is uneven; recorded locations and archaeological associations do not establish personal origin or cultural identity.